| 2025-12-15 09:26:05+08:00 |
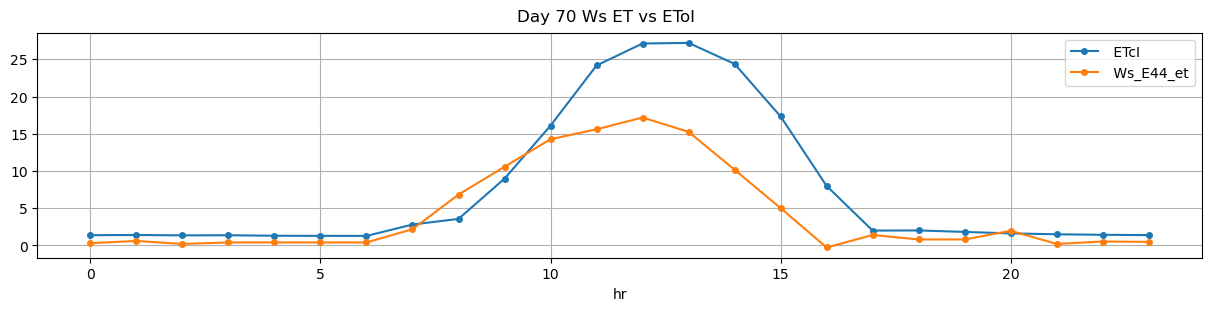
70 |
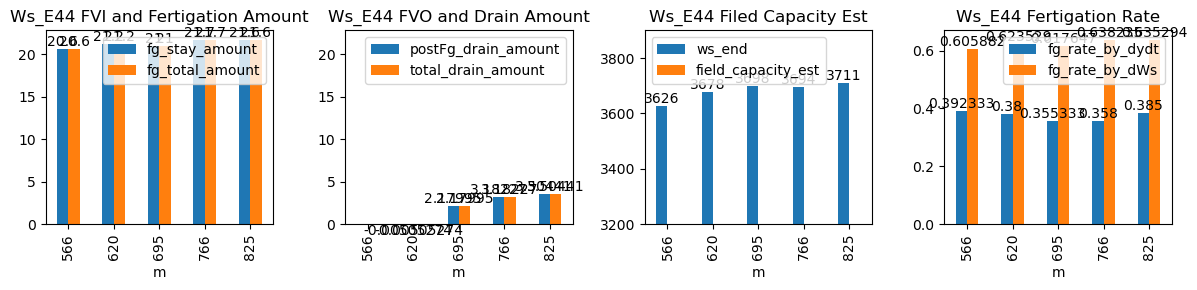
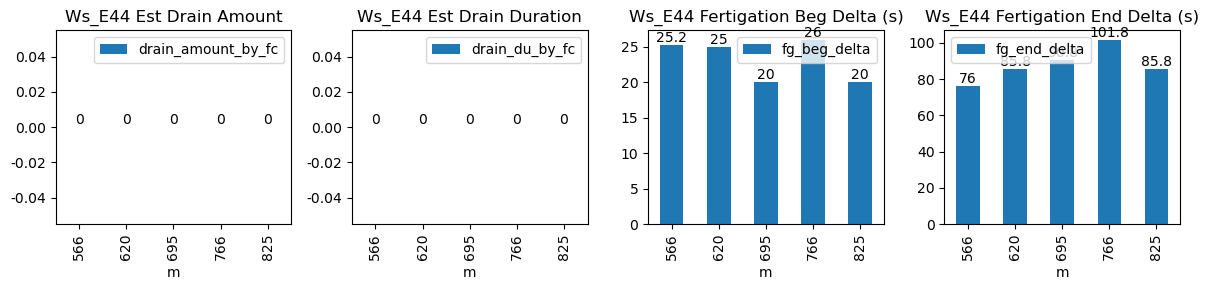
566 |
Ws_E44 |
0.899233 |
30 |
566.08 |
566.500000 |
566.65 |
567.916667 |
NaN |
NaN |
NaN |
3523.0 |
3626.0 |
34 |
-0.058194 |
-0.069722 |
-0.113194 |
0.392333 |
0.605882 |
20.6 |
25.2 |
76.0 |
20.6 |
0.0 |
-1.004403 |
NaN |
-1.004403 |
| 2025-12-15 10:20:00+08:00 |
70 |
620 |
Ws_E44 |
0.899233 |
30 |
620.00 |
620.416667 |
620.57 |
622.000000 |
NaN |
NaN |
NaN |
3572.0 |
3678.0 |
34 |
-0.087288 |
-0.207222 |
-0.109583 |
0.380000 |
0.623529 |
21.2 |
25.0 |
85.8 |
21.2 |
0.0 |
-0.005053 |
NaN |
-0.005053 |
| 2025-12-15 11:35:00+08:00 |
70 |
695 |
Ws_E44 |
0.899233 |
30 |
695.00 |
695.333333 |
695.57 |
697.083333 |
NaN |
NaN |
NaN |
3593.0 |
3698.0 |
34 |
-0.127236 |
-0.268889 |
-0.131910 |
0.355333 |
0.617647 |
21.0 |
20.0 |
90.8 |
21.0 |
0.0 |
2.179950 |
NaN |
2.179950 |
| 2025-12-15 12:46:09+08:00 |
70 |
766 |
Ws_E44 |
0.899233 |
30 |
766.15 |
766.583333 |
766.72 |
768.416667 |
NaN |
NaN |
NaN |
3585.5 |
3694.0 |
34 |
-0.123368 |
-0.257222 |
-0.102340 |
0.358000 |
0.638235 |
21.7 |
26.0 |
101.8 |
21.7 |
0.0 |
3.182273 |
NaN |
3.182273 |
| 2025-12-15 13:45:00+08:00 |
70 |
825 |
Ws_E44 |
0.899233 |
30 |
825.00 |
825.333333 |
825.57 |
827.000000 |
NaN |
NaN |
NaN |
3603.0 |
3711.0 |
34 |
-0.096057 |
-0.296806 |
-0.094306 |
0.385000 |
0.635294 |
21.6 |
20.0 |
85.8 |
21.6 |
0.0 |
3.504414 |
NaN |
3.504414 |