| 2026-01-03 10:15:00+08:00 |
89 |
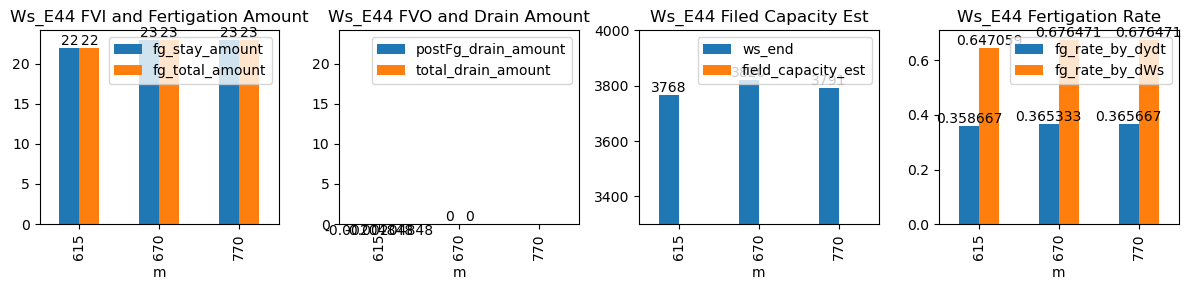
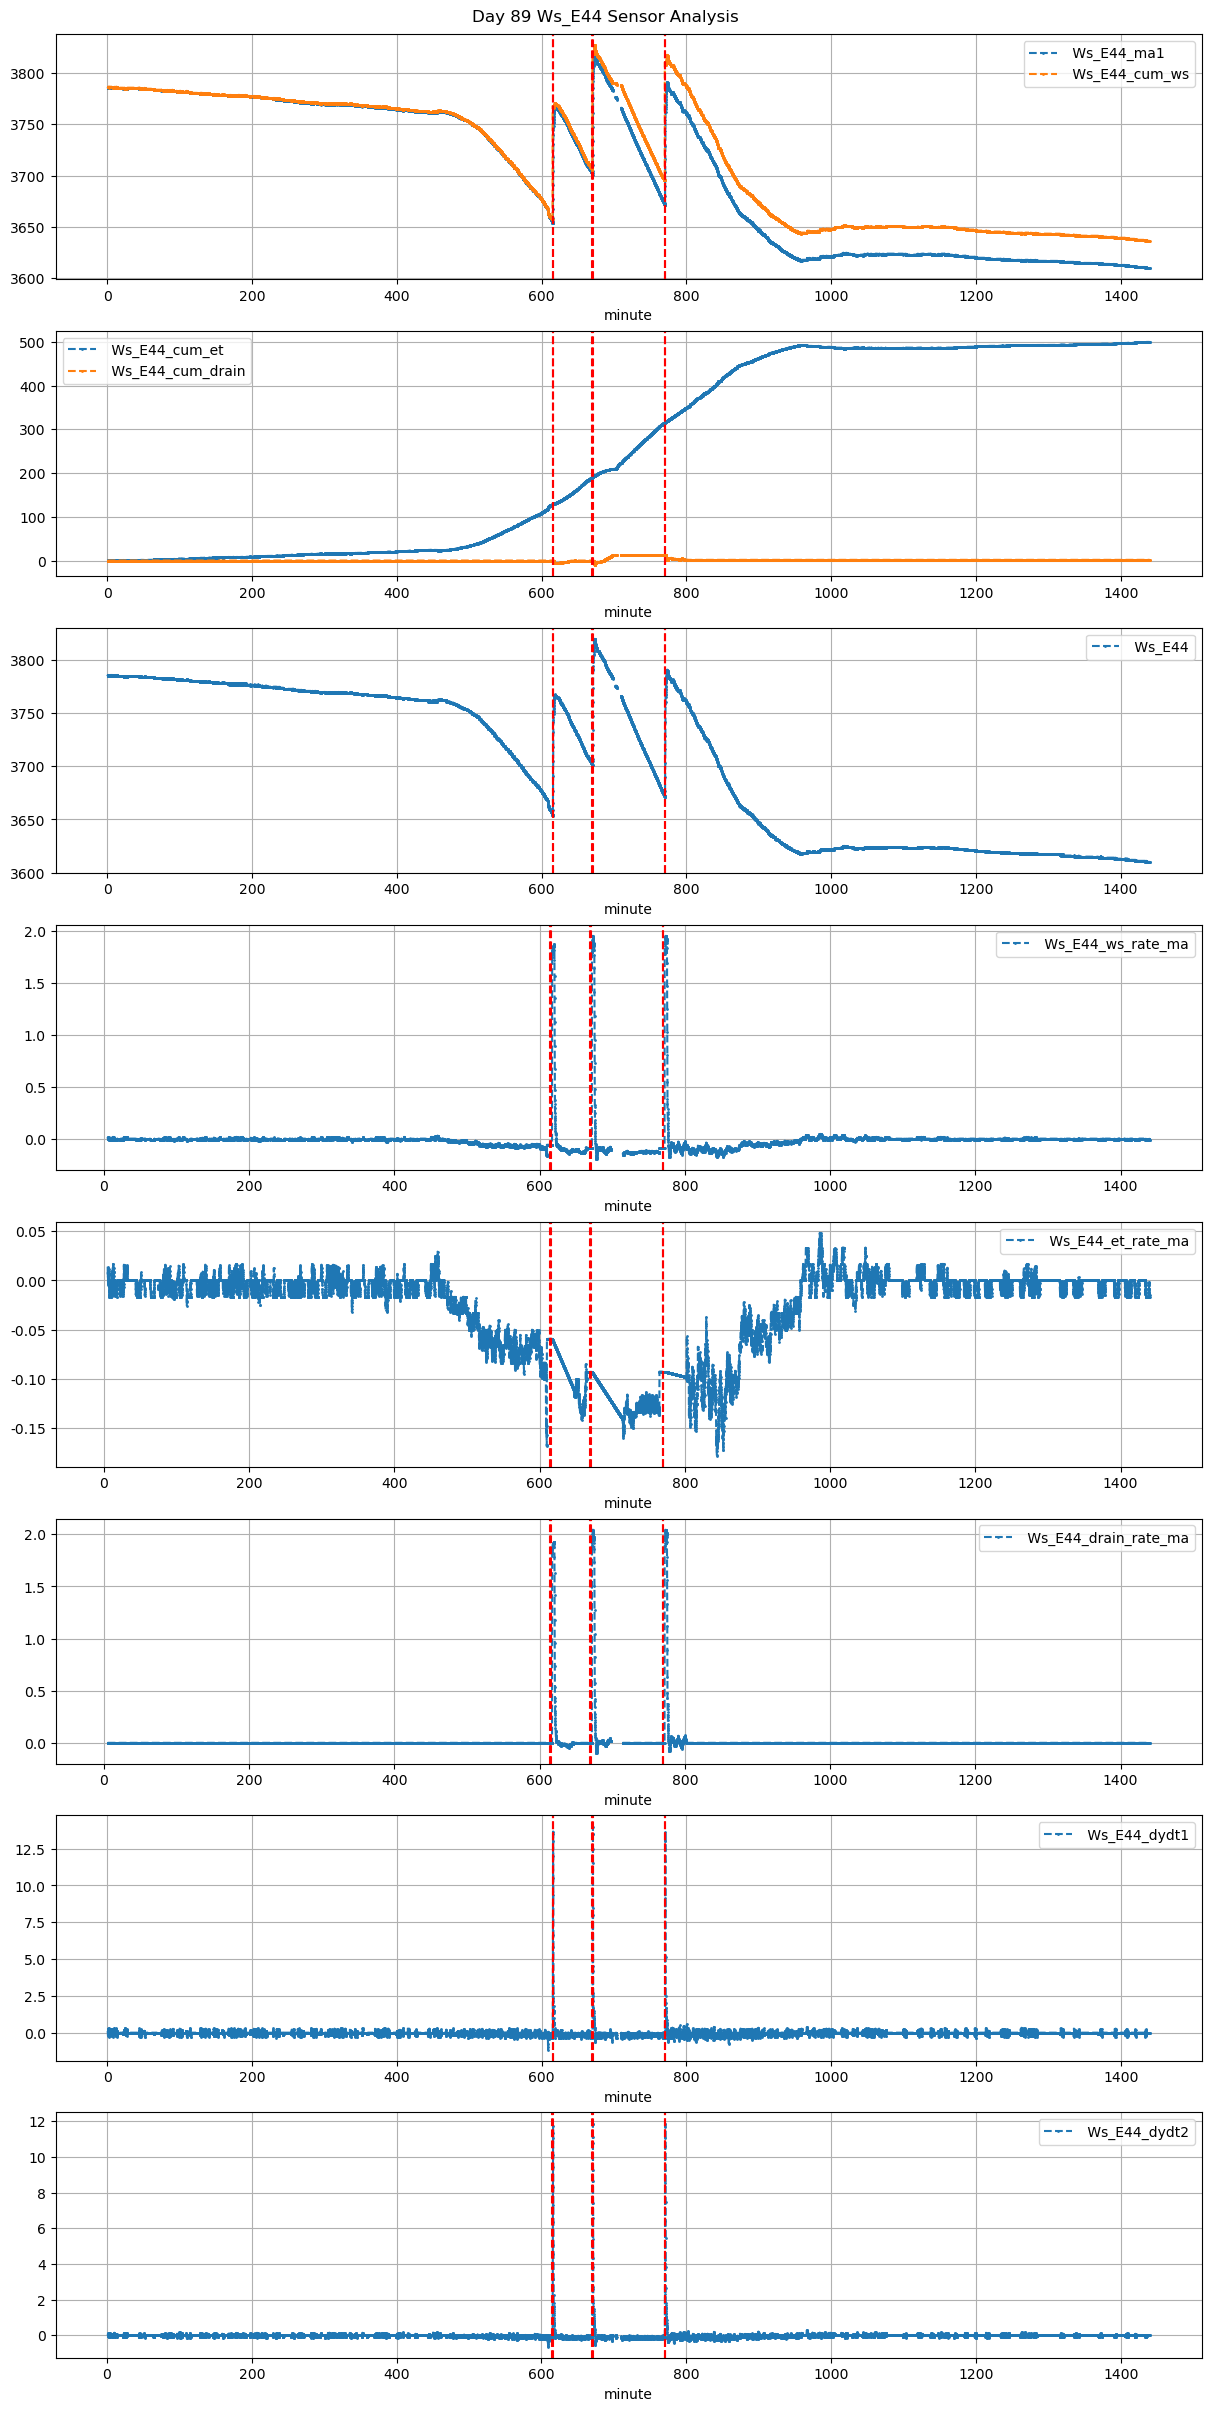
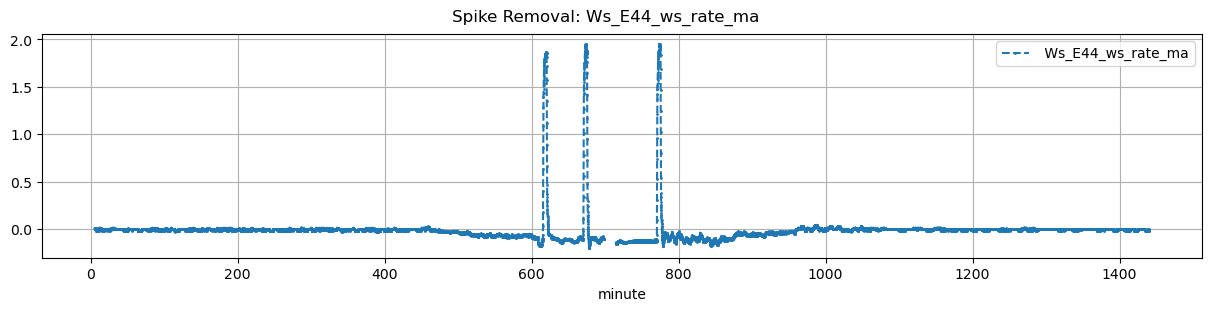
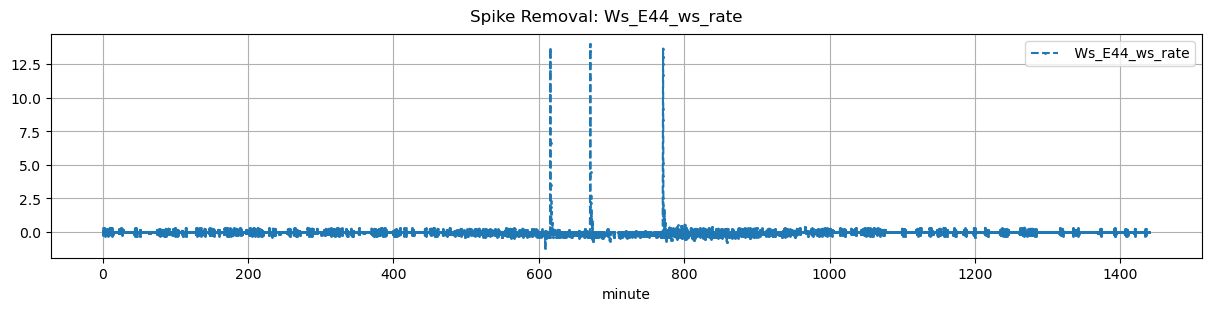
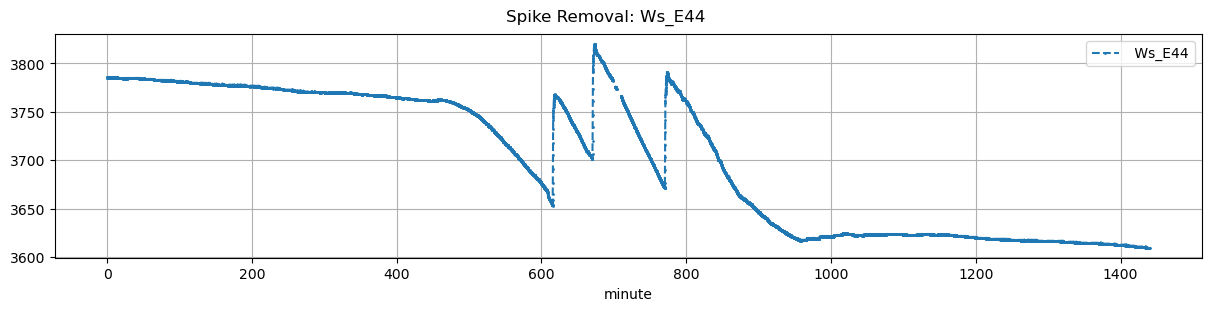
615 |
Ws_E44 |
0.313031 |
30 |
615.0 |
615.416667 |
615.57 |
617.250000 |
NaN |
NaN |
NaN |
3658.0 |
3768.0 |
34 |
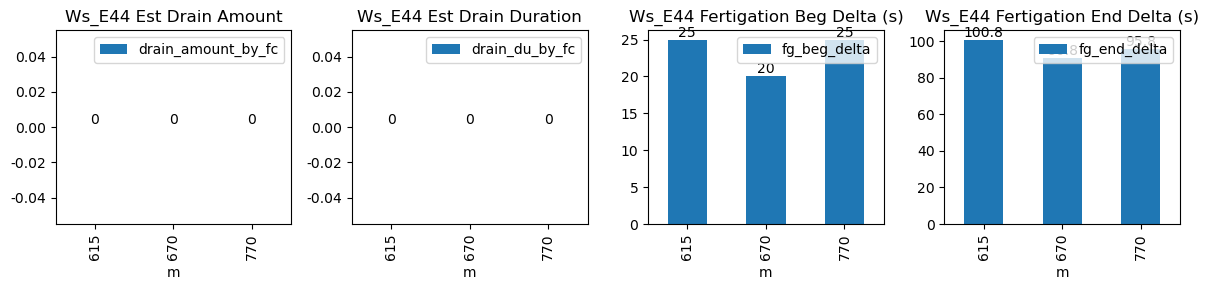
-0.158037 |
-0.059306 |
-0.111183 |
0.358667 |
0.647059 |
22.0 |
25.0 |
100.8 |
22.0 |
0.0 |
-0.002048 |
NaN |
-0.002048 |
| 2026-01-03 11:10:00+08:00 |
89 |
670 |
Ws_E44 |
0.313031 |
30 |
670.0 |
670.333333 |
670.57 |
672.083333 |
NaN |
NaN |
NaN |
3705.0 |
3820.0 |
34 |
-0.092747 |
-0.119676 |
NaN |
0.365333 |
0.676471 |
23.0 |
20.0 |
90.8 |
23.0 |
0.0 |
NaN |
NaN |
NaN |
| 2026-01-03 12:50:00+08:00 |
89 |
770 |
Ws_E44 |
0.313031 |
30 |
770.0 |
770.416667 |
770.57 |
772.166667 |
NaN |
NaN |
NaN |
3676.0 |
3791.0 |
34 |
-0.124270 |
-0.092500 |
-0.098148 |
0.365667 |
0.676471 |
23.0 |
25.0 |
95.8 |
23.0 |
0.0 |
-2.243868 |
NaN |
-2.243868 |