| 2026-01-02 10:50:00+08:00 |
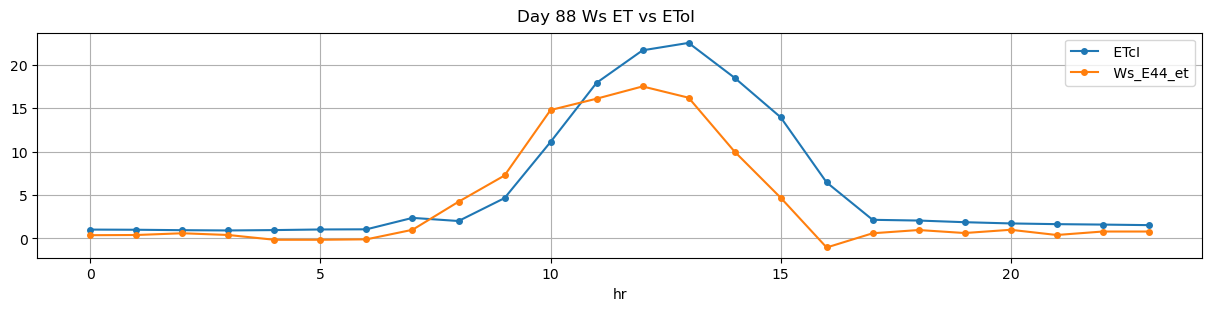
88 |
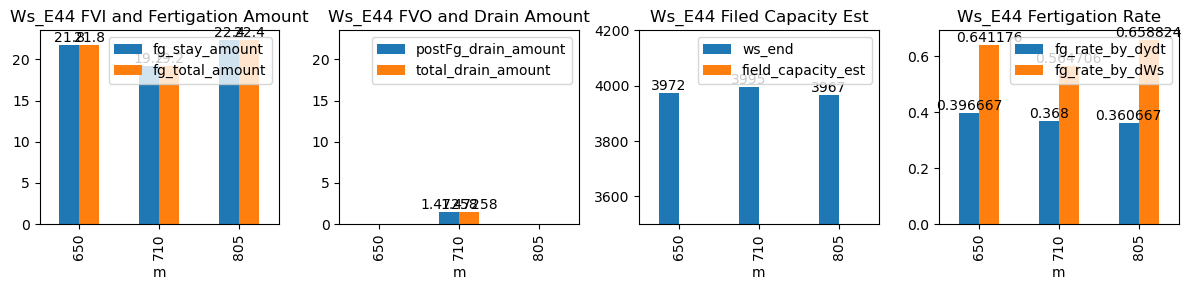
650 |
Ws_E44 |
0.845557 |
30 |
650.0 |
650.416667 |
650.57 |
651.916667 |
NaN |
NaN |
NaN |
3863.0 |
3972.0 |
34 |
-0.105202 |
-0.137361 |
-0.119907 |
0.396667 |
0.641176 |
21.8 |
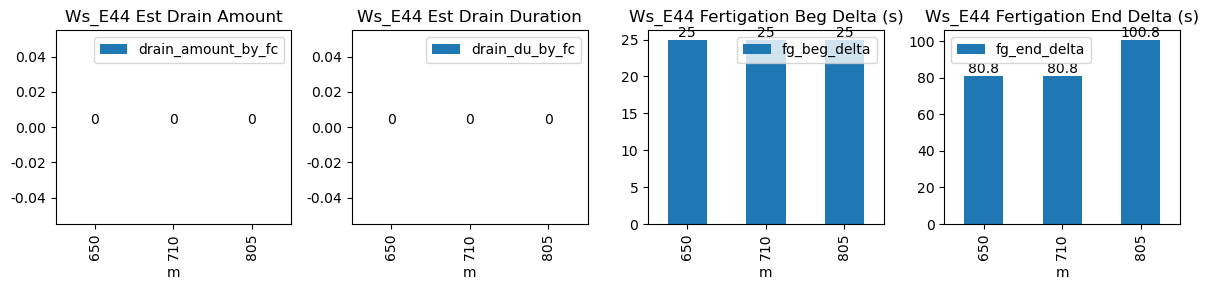
25.0 |
80.8 |
21.8 |
0.0 |
-1.516044 |
NaN |
-1.516044 |
| 2026-01-02 11:50:00+08:00 |
88 |
710 |
Ws_E44 |
0.845557 |
30 |
710.0 |
710.416667 |
710.57 |
711.916667 |
NaN |
NaN |
NaN |
3899.0 |
3995.0 |
34 |
-0.117479 |
-0.210000 |
-0.120015 |
0.368000 |
0.564706 |
19.2 |
25.0 |
80.8 |
19.2 |
0.0 |
1.472585 |
NaN |
1.472585 |
| 2026-01-02 13:25:00+08:00 |
88 |
805 |
Ws_E44 |
0.845557 |
30 |
805.0 |
805.416667 |
805.57 |
807.250000 |
NaN |
NaN |
NaN |
3855.0 |
3967.0 |
34 |
-0.137843 |
-0.171528 |
-0.072937 |
0.360667 |
0.658824 |
22.4 |
25.0 |
100.8 |
22.4 |
0.0 |
-1.070721 |
NaN |
-1.070721 |