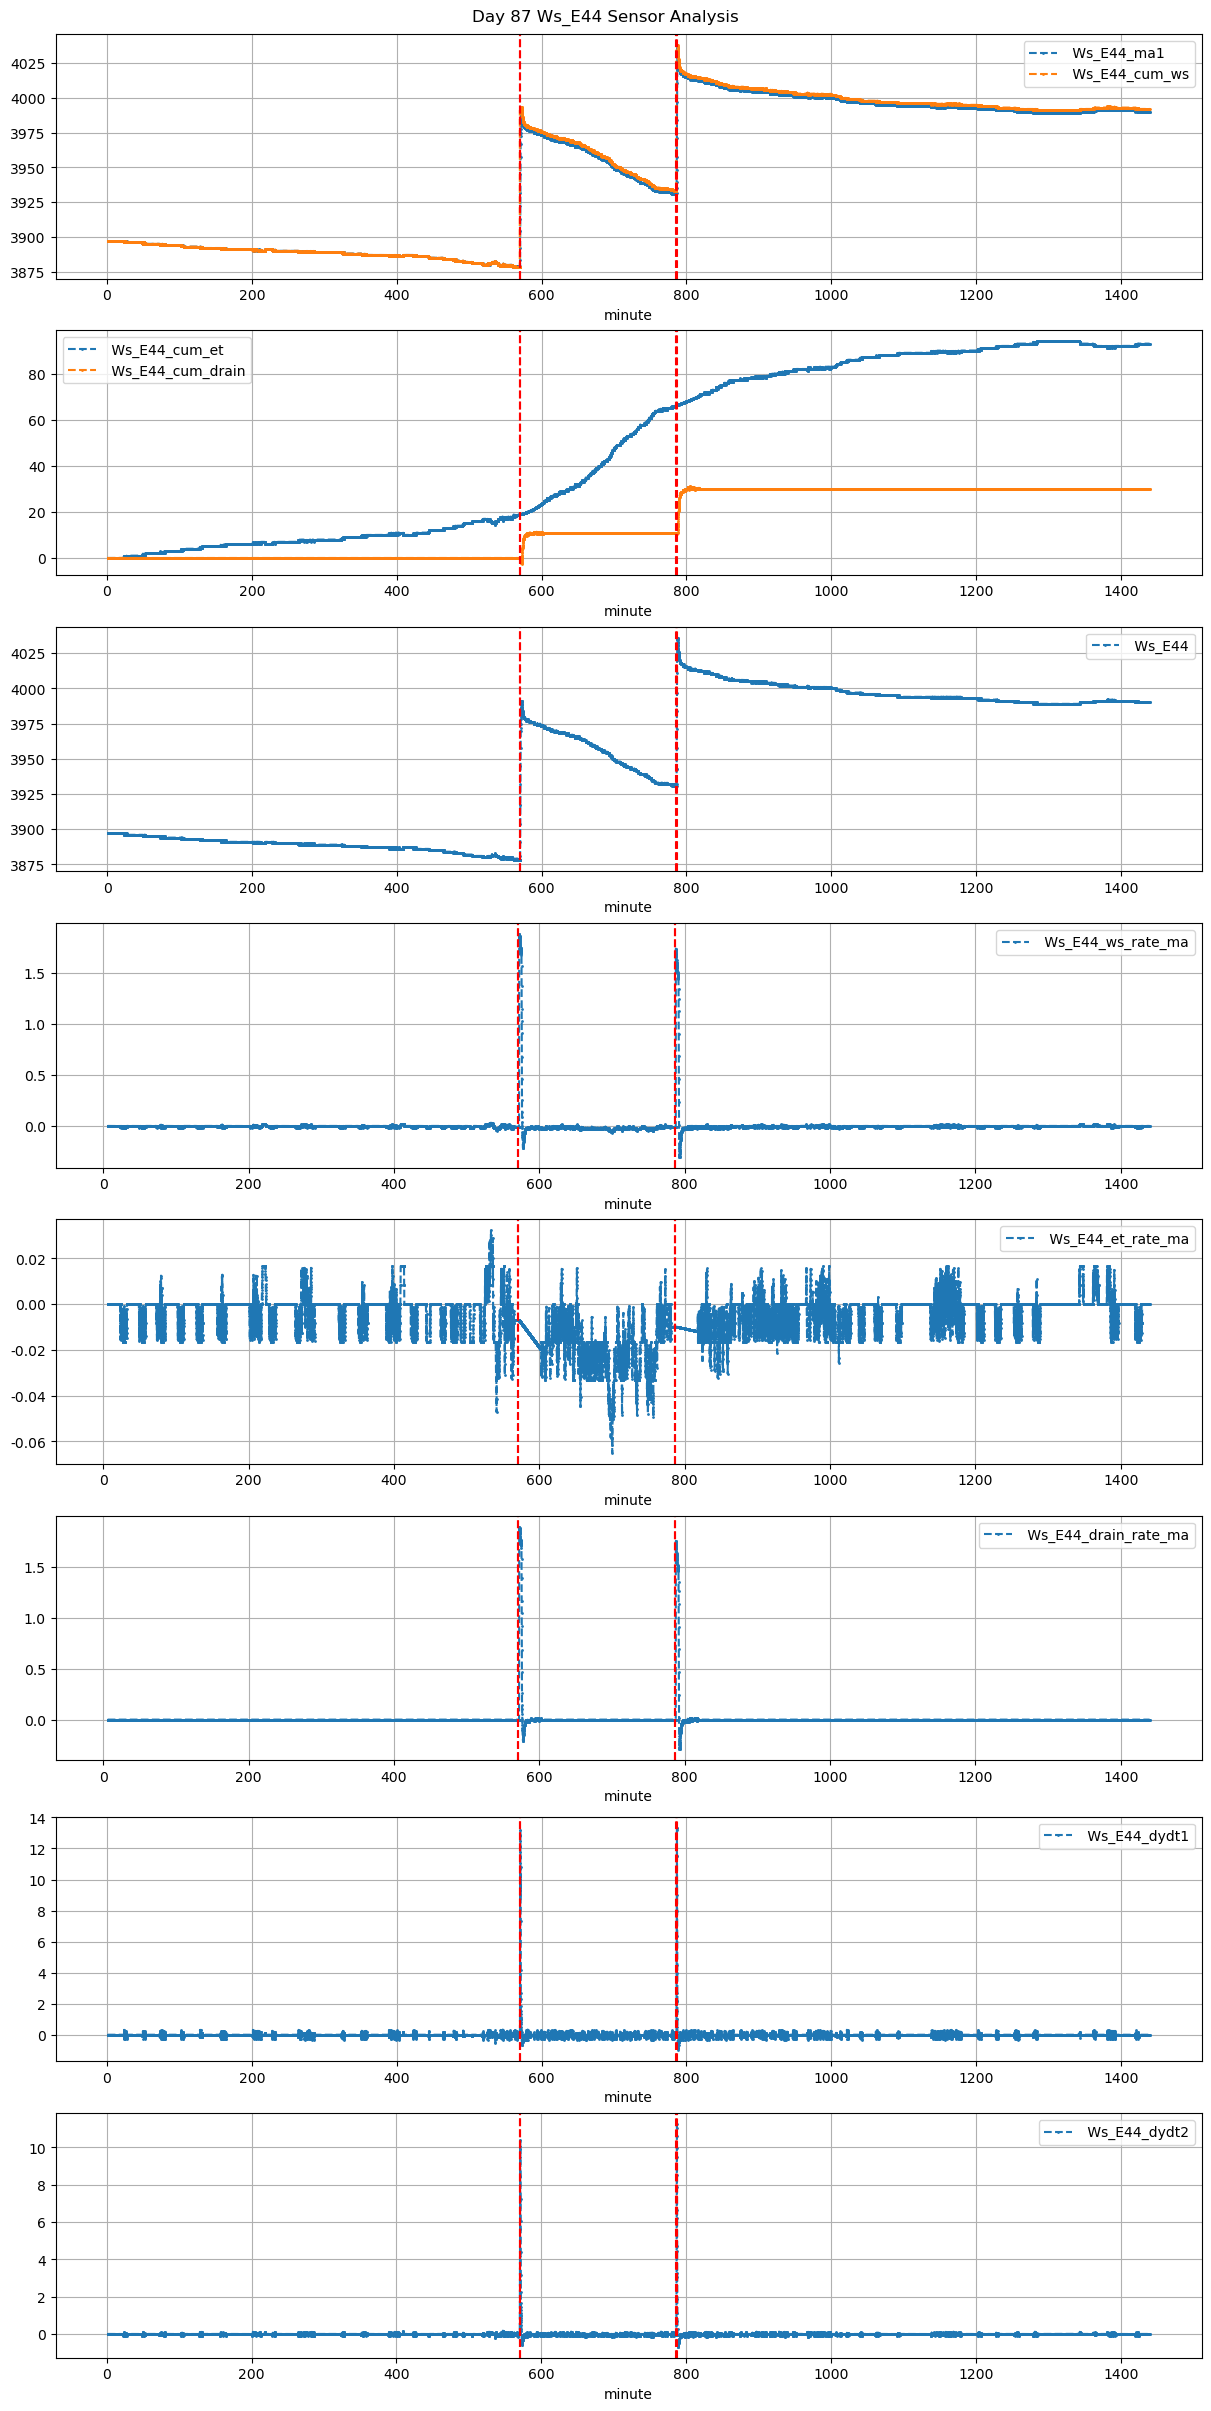
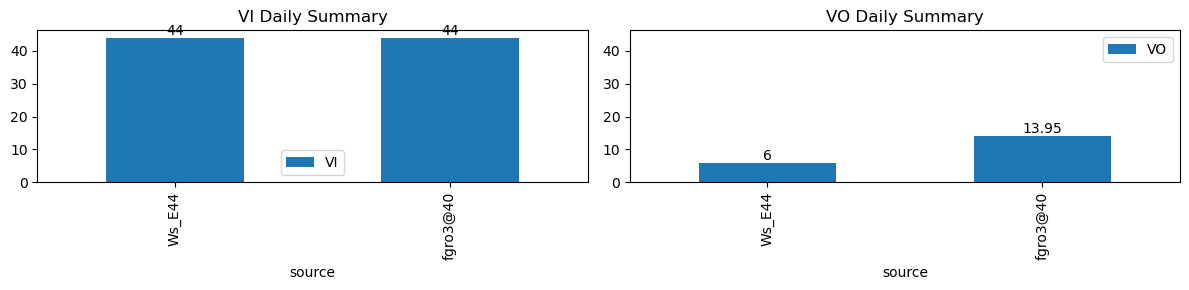
VI and VO Daily Summary
| ws_name | total_dp | nan_dp | nan_filled_dp | long_gap_dp | num_spike |
|---|---|---|---|---|---|
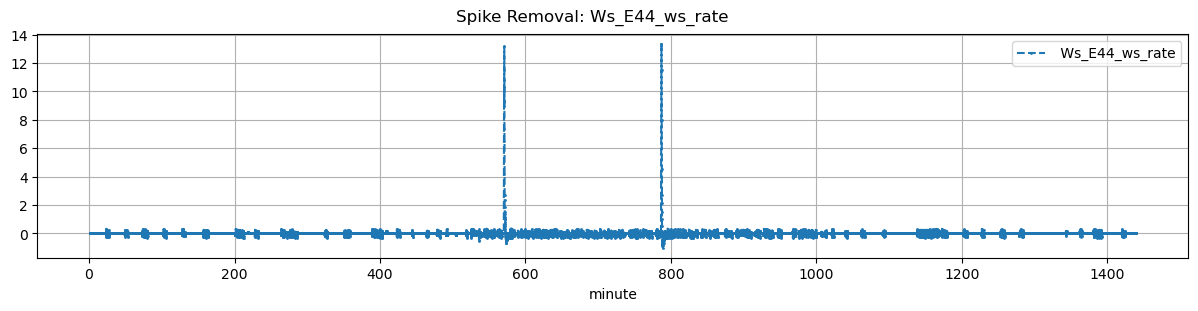
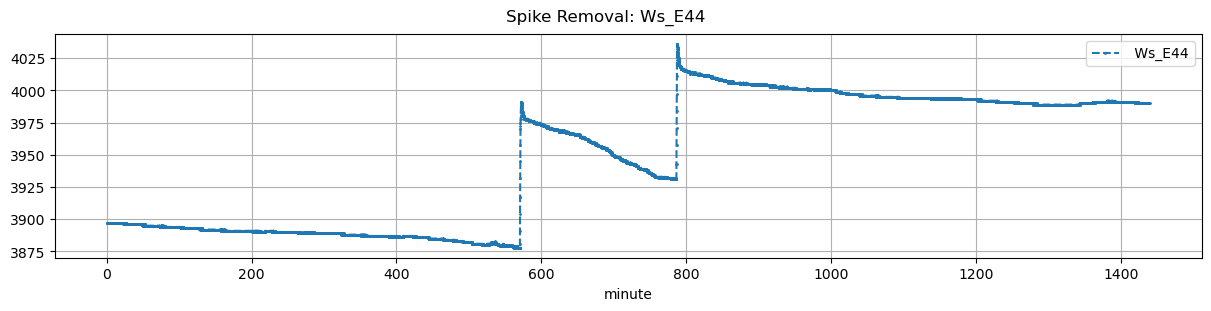
| Ws_E44 | 17268 | 0 | 14368 | 0 | 0 |
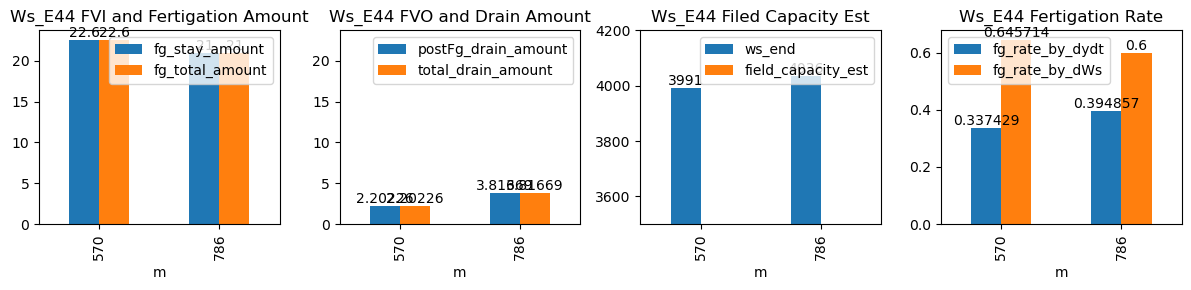
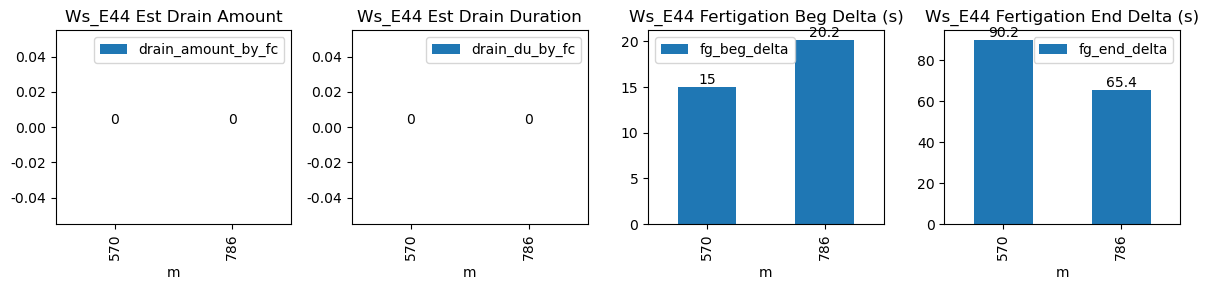
| ds | d | m | ws_name | prominence_cut | max_drain_du | fg_beg | fg_beg_est | fg_end | fg_end_est | drain_amount_by_fc | drain_du_by_fc | drain_rate_by_fc | ws_beg | ws_end | duc | pre_fg_et | post_fg_ws | post_drn_et | fg_rate_by_dydt | fg_rate_by_dWs | fg_stay_amount | fg_beg_delta | fg_end_delta | fg_total_amount | fg_drain_amount | postFg_drain_amount | field_capacity_est | total_drain_amount |
|---|---|---|---|---|---|---|---|---|---|---|---|---|---|---|---|---|---|---|---|---|---|---|---|---|---|---|---|---|
| 2026-01-01 09:30:00+08:00 | 87 | 570 | Ws_E44 | 0.197335 | 30 | 570.00 | 570.250000 | 570.58 | 572.083333 | NaN | NaN | NaN | 3878.0 | 3991.0 | 35 | -0.006992 | -0.091528 | -0.019784 | 0.337429 | 0.645714 | 22.6 | 15.0 | 90.2 | 22.6 | 0.0 | 2.202264 | NaN | 2.202264 |
| 2026-01-01 13:06:05+08:00 | 87 | 786 | Ws_E44 | 0.197335 | 30 | 786.08 | 786.416667 | 786.66 | 787.750000 | NaN | NaN | NaN | 3931.0 | 4036.0 | 35 | -0.009769 | -0.116944 | -0.011852 | 0.394857 | 0.600000 | 21.0 | 20.2 | 65.4 | 21.0 | 0.0 | 3.816688 | NaN | 3.816688 |