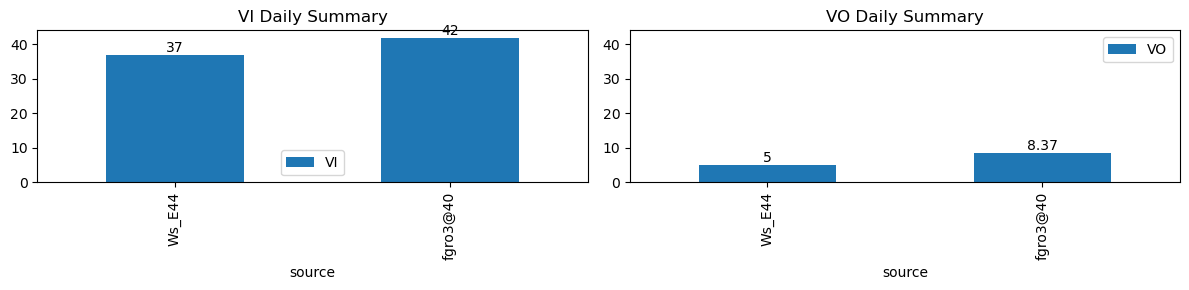
VI and VO Daily Summary
| ws_name | total_dp | nan_dp | nan_filled_dp | long_gap_dp | num_spike |
|---|---|---|---|---|---|
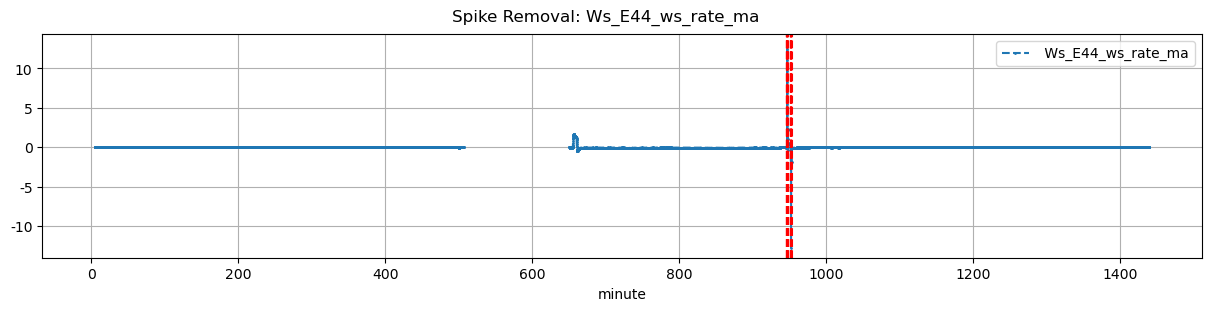
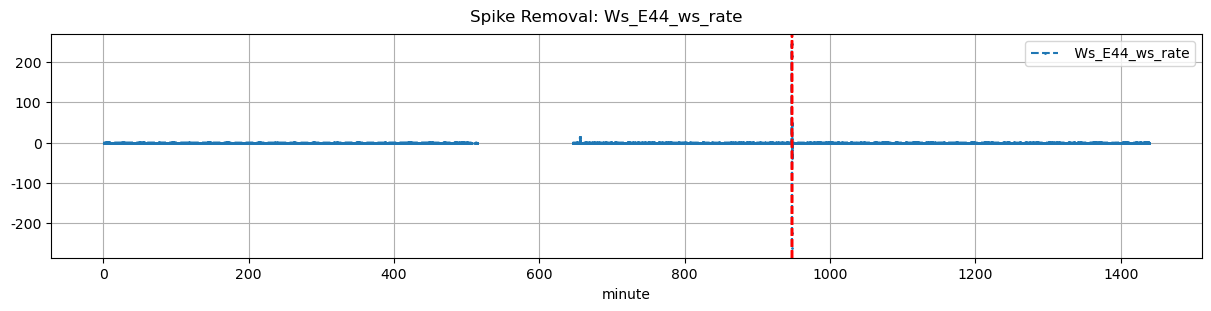
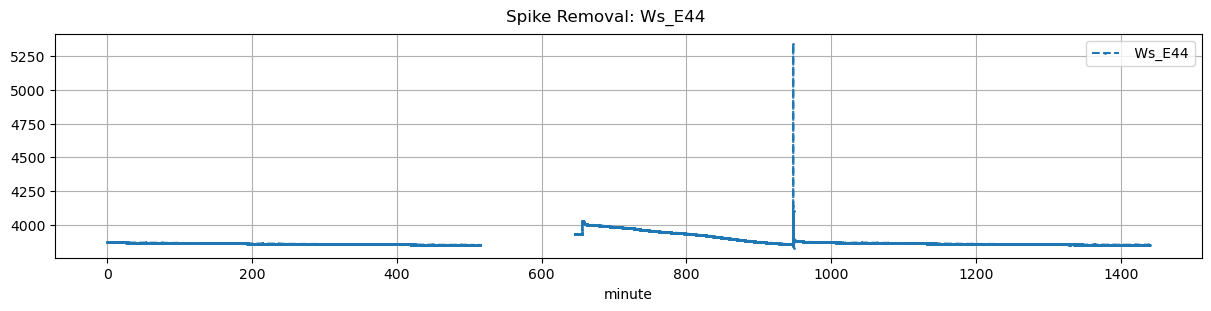
| Ws_E44 | 17273 | 1627 | 13107 | 1627 | 0 |
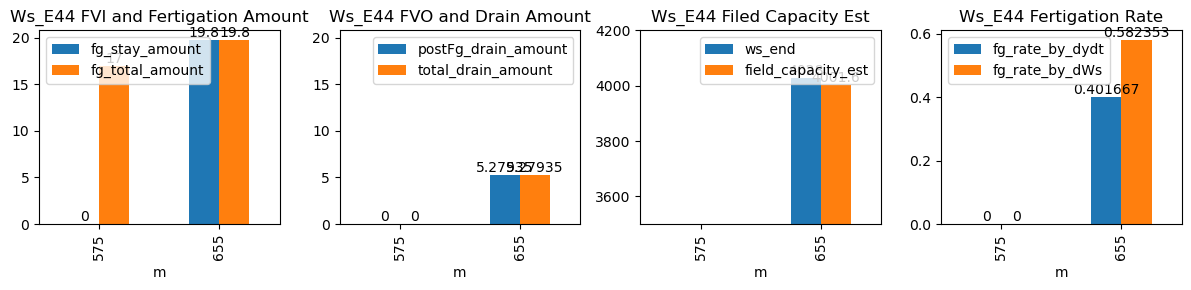
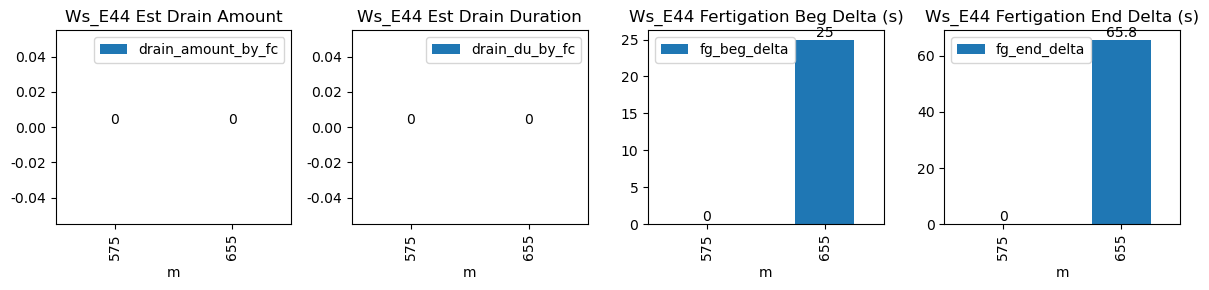
| ds | d | m | ws_name | prominence_cut | max_drain_du | fg_beg | fg_beg_est | fg_end | fg_end_est | drain_amount_by_fc | drain_du_by_fc | drain_rate_by_fc | ws_beg | ws_end | duc | pre_fg_et | post_fg_ws | post_drn_et | fg_rate_by_dydt | fg_rate_by_dWs | fg_stay_amount | fg_beg_delta | fg_end_delta | fg_total_amount | fg_drain_amount | postFg_drain_amount | field_capacity_est | total_drain_amount |
|---|---|---|---|---|---|---|---|---|---|---|---|---|---|---|---|---|---|---|---|---|---|---|---|---|---|---|---|---|
| 2025-12-22 09:35:00+08:00 | 77 | 575 | Ws_E44 | 5.634057 | 30 | 575.0 | NaN | 575.57 | NaN | NaN | NaN | NaN | NaN | NaN | 34 | NaN | NaN | NaN | NaN | NaN | NaN | NaN | NaN | 17.0 | NaN | NaN | NaN | NaN |
| 2025-12-22 10:55:00+08:00 | 77 | 655 | Ws_E44 | 5.634057 | 30 | 655.0 | 655.416667 | 655.57 | 656.666667 | NaN | NaN | NaN | 3929.0 | 4028.0 | 34 | -0.023718 | -0.179583 | -0.038477 | 0.401667 | 0.582353 | 19.8 | 25.0 | 65.8 | 19.8 | 0.0 | 5.279349 | 4001.603253 | 5.279349 |