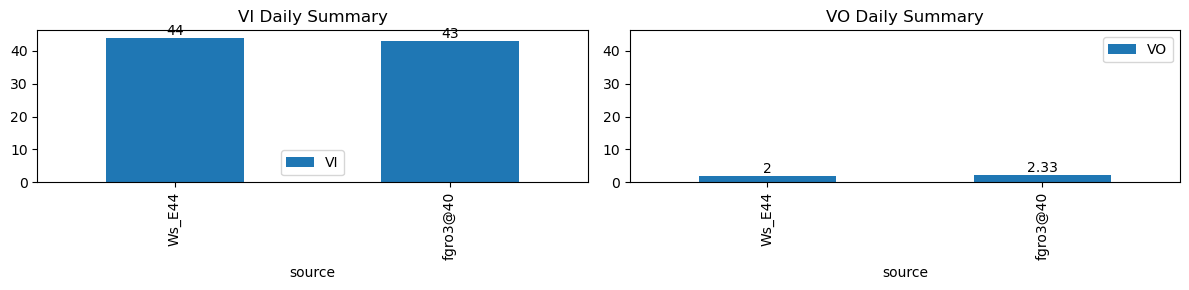
VI and VO Daily Summary
| ws_name | total_dp | nan_dp | nan_filled_dp | long_gap_dp | num_spike |
|---|---|---|---|---|---|
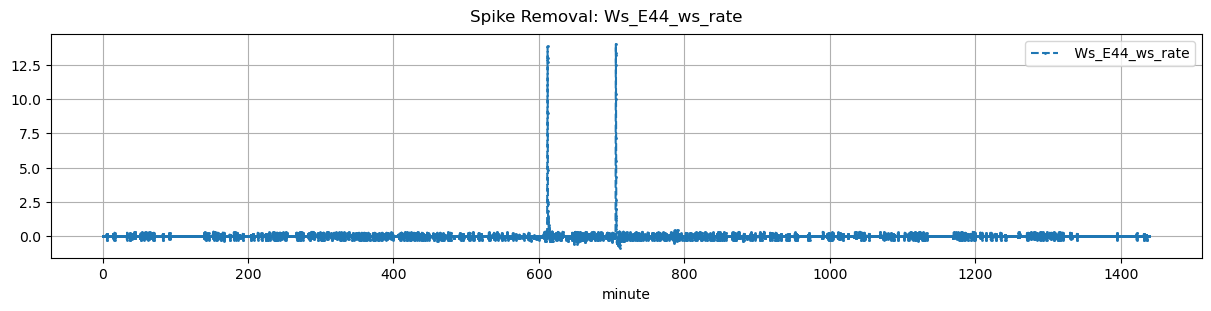
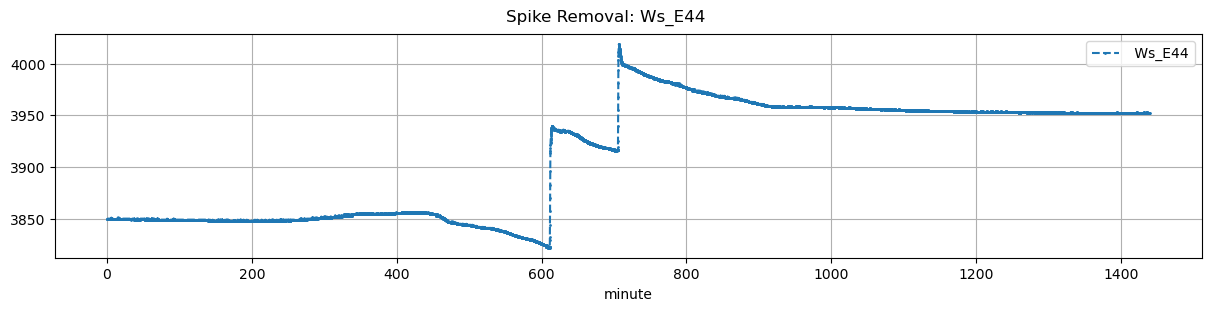
| Ws_E44 | 17269 | 0 | 14145 | 0 | 0 |
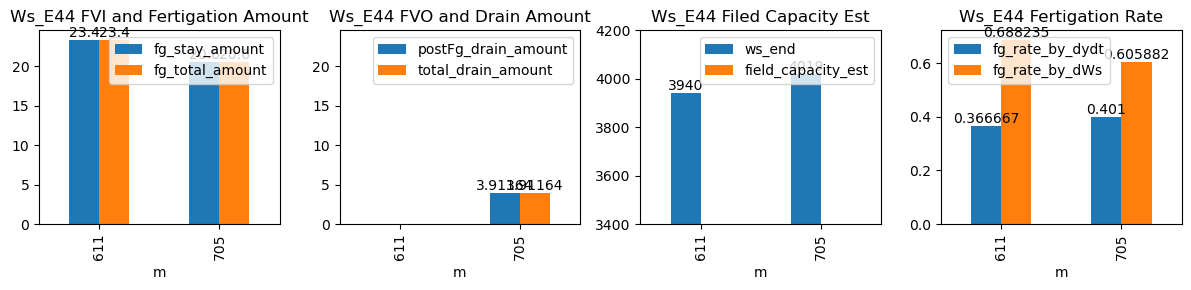
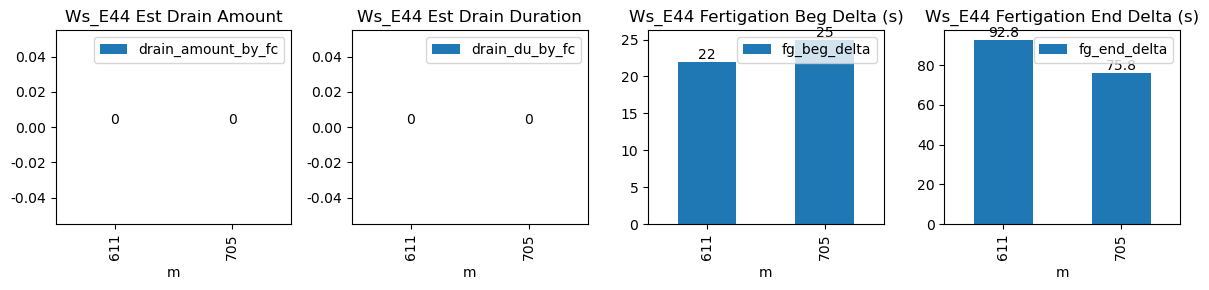
| ds | d | m | ws_name | prominence_cut | max_drain_du | fg_beg | fg_beg_est | fg_end | fg_end_est | drain_amount_by_fc | drain_du_by_fc | drain_rate_by_fc | ws_beg | ws_end | duc | pre_fg_et | post_fg_ws | post_drn_et | fg_rate_by_dydt | fg_rate_by_dWs | fg_stay_amount | fg_beg_delta | fg_end_delta | fg_total_amount | fg_drain_amount | postFg_drain_amount | field_capacity_est | total_drain_amount |
|---|---|---|---|---|---|---|---|---|---|---|---|---|---|---|---|---|---|---|---|---|---|---|---|---|---|---|---|---|
| 2025-12-23 10:11:03+08:00 | 78 | 611 | Ws_E44 | 0.210939 | 30 | 611.05 | 611.416667 | 611.62 | 613.166667 | NaN | NaN | NaN | 3823.0 | 3940.0 | 34 | -0.024000 | -0.028472 | -0.029258 | 0.366667 | 0.688235 | 23.4 | 22.0 | 92.8 | 23.4 | 0.0 | -1.718252 | NaN | -1.718252 |
| 2025-12-23 11:45:00+08:00 | 78 | 705 | Ws_E44 | 0.210939 | 30 | 705.00 | 705.416667 | 705.57 | 706.833333 | NaN | NaN | NaN | 3916.0 | 4019.0 | 34 | -0.011052 | -0.135139 | -0.030803 | 0.401000 | 0.605882 | 20.6 | 25.0 | 75.8 | 20.6 | 0.0 | 3.911641 | NaN | 3.911641 |