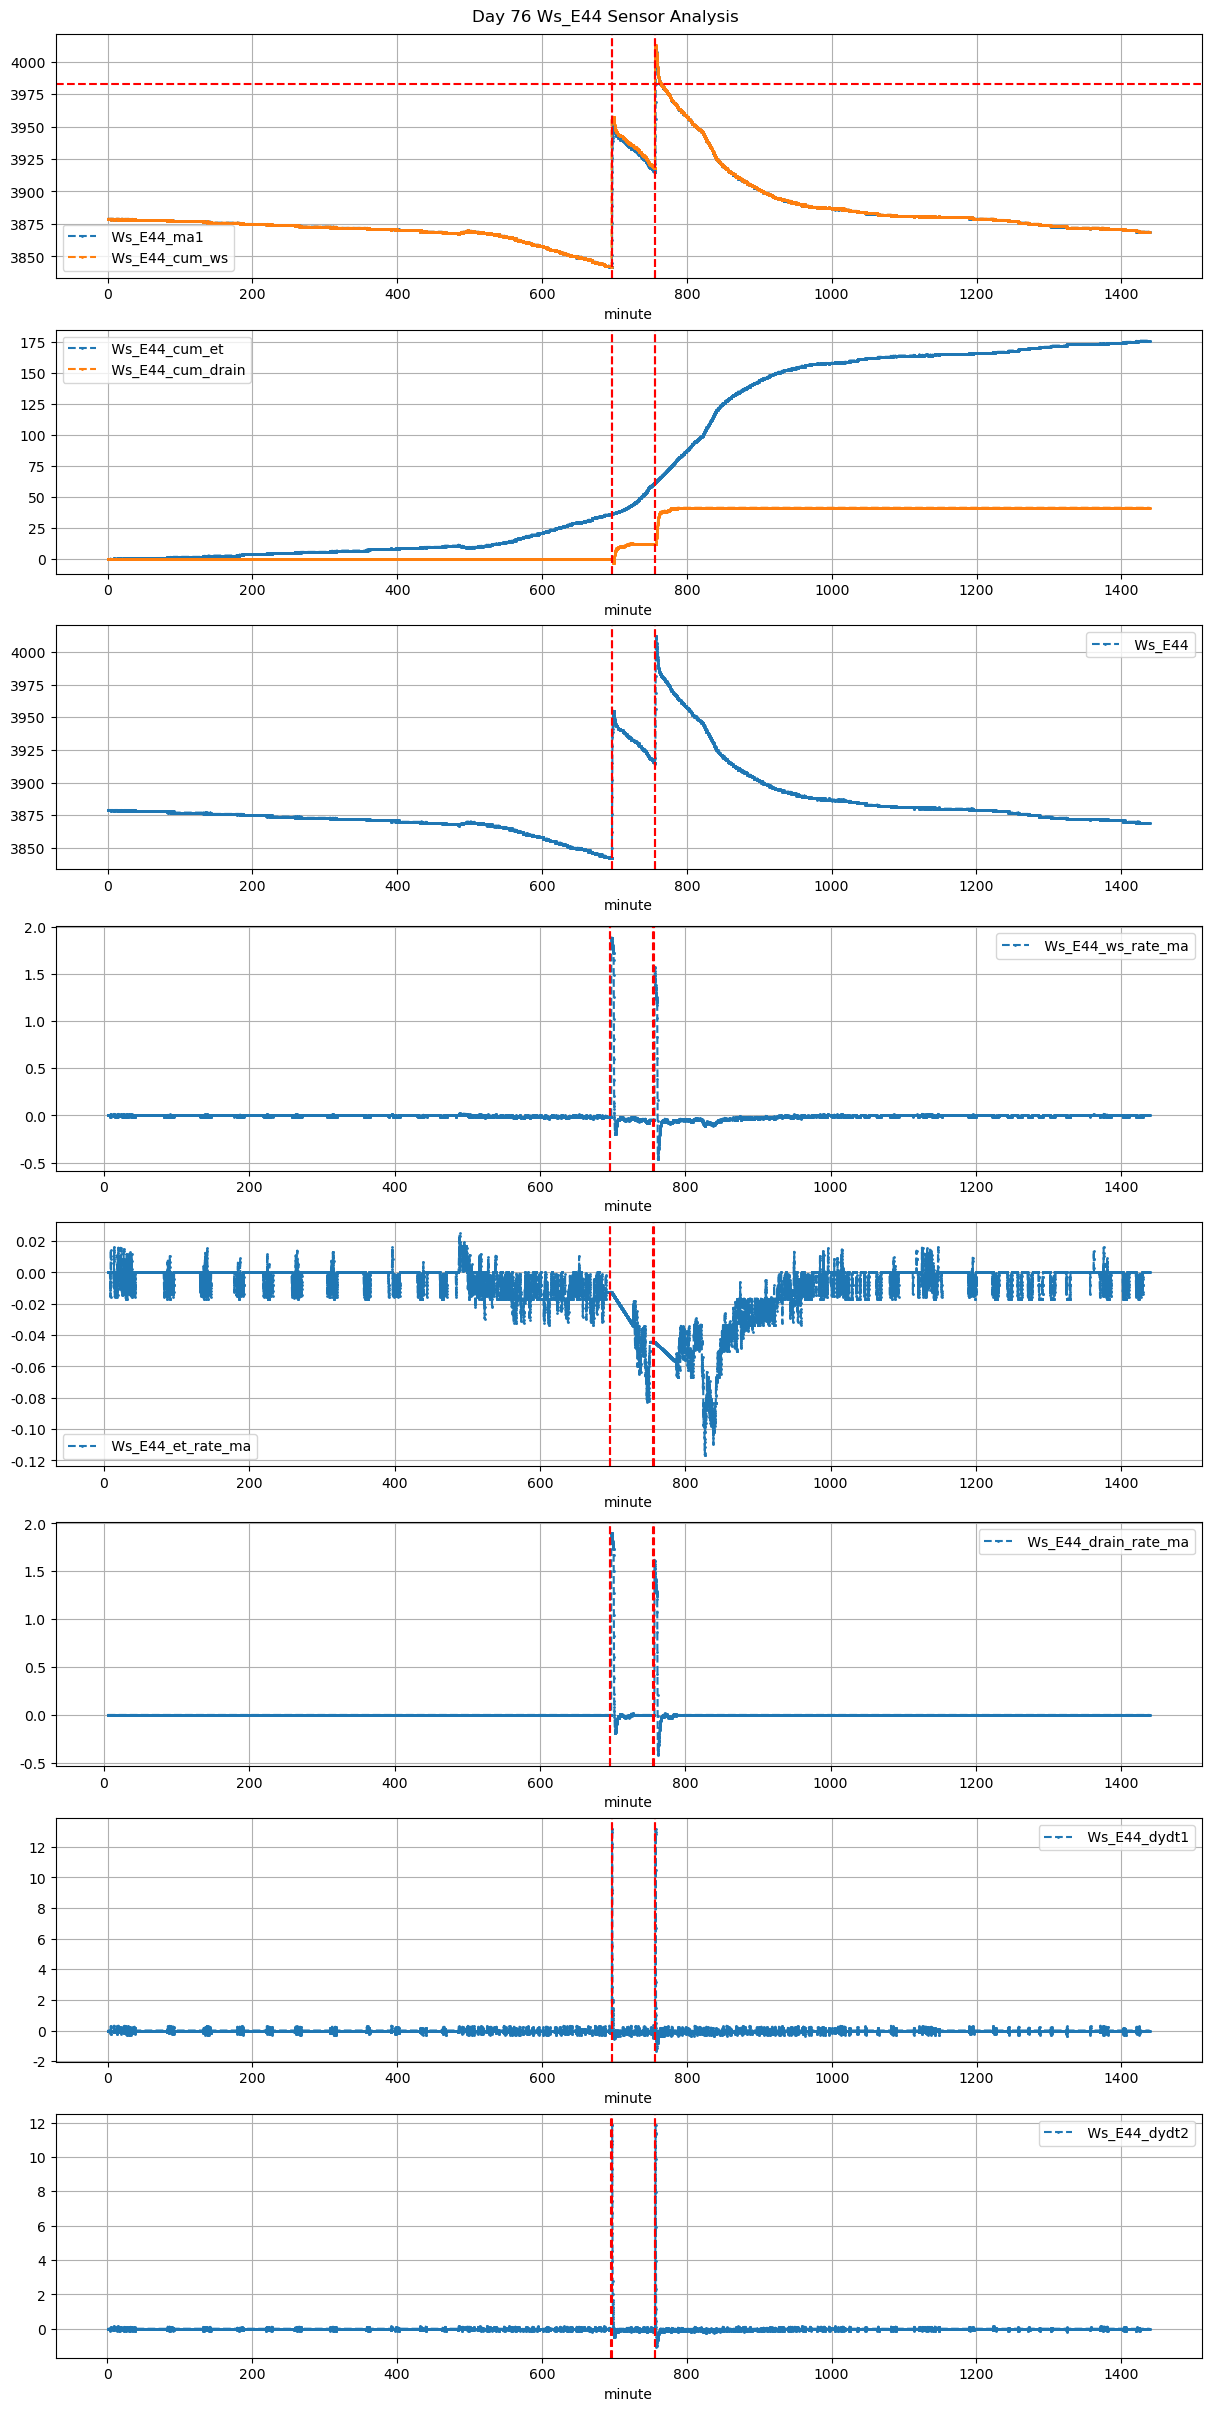
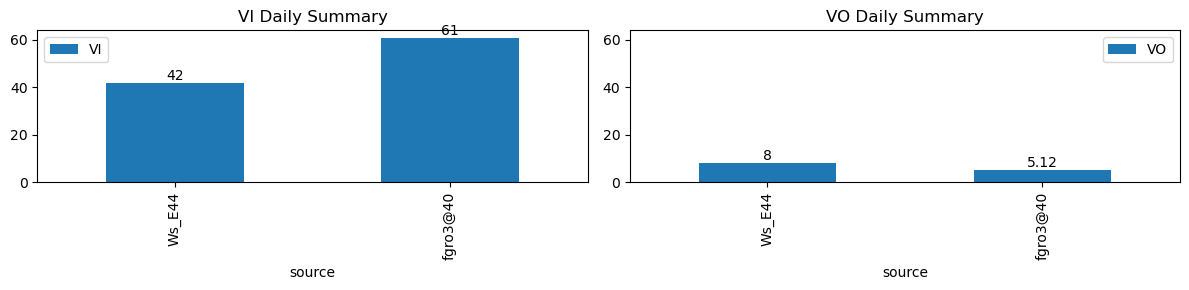
VI and VO Daily Summary
| ws_name | total_dp | nan_dp | nan_filled_dp | long_gap_dp | num_spike |
|---|---|---|---|---|---|
| Ws_E44 | 17269 | 0 | 14427 | 0 | 0 |
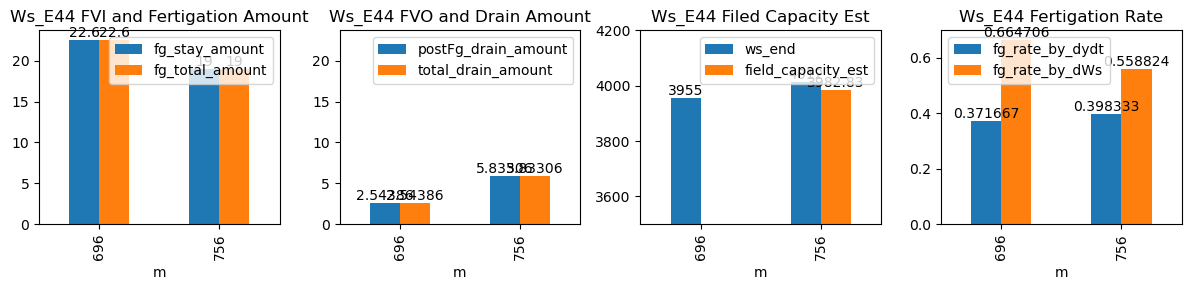
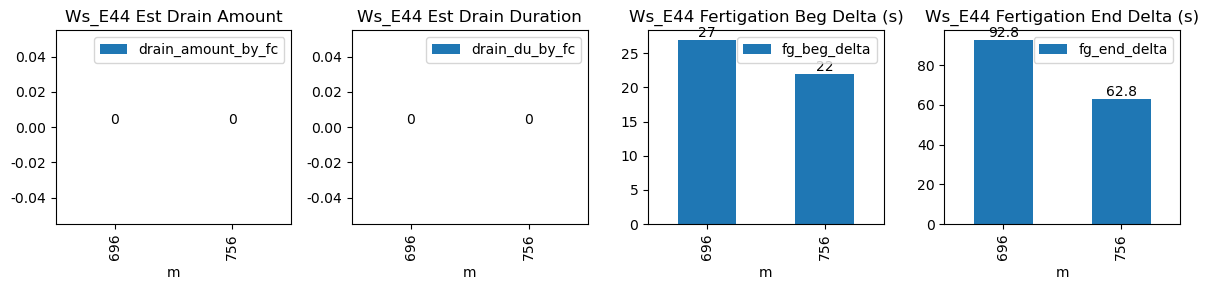
| ds | d | m | ws_name | prominence_cut | max_drain_du | fg_beg | fg_beg_est | fg_end | fg_end_est | drain_amount_by_fc | drain_du_by_fc | drain_rate_by_fc | ws_beg | ws_end | duc | pre_fg_et | post_fg_ws | post_drn_et | fg_rate_by_dydt | fg_rate_by_dWs | fg_stay_amount | fg_beg_delta | fg_end_delta | fg_total_amount | fg_drain_amount | postFg_drain_amount | field_capacity_est | total_drain_amount |
|---|---|---|---|---|---|---|---|---|---|---|---|---|---|---|---|---|---|---|---|---|---|---|---|---|---|---|---|---|
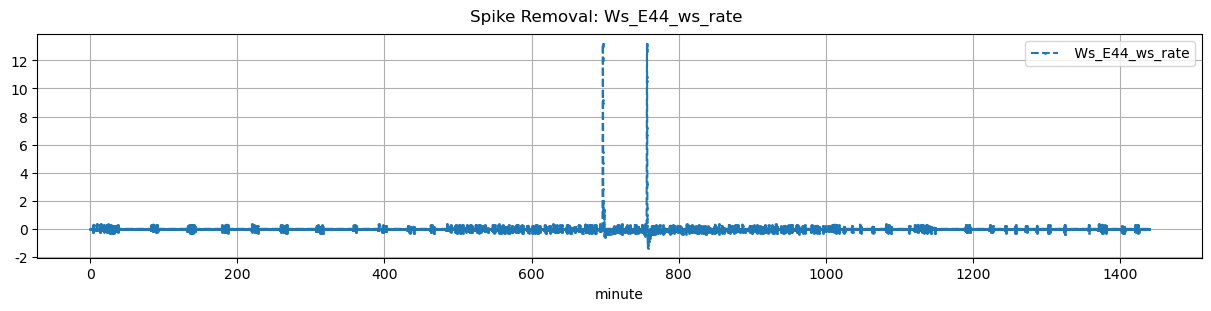
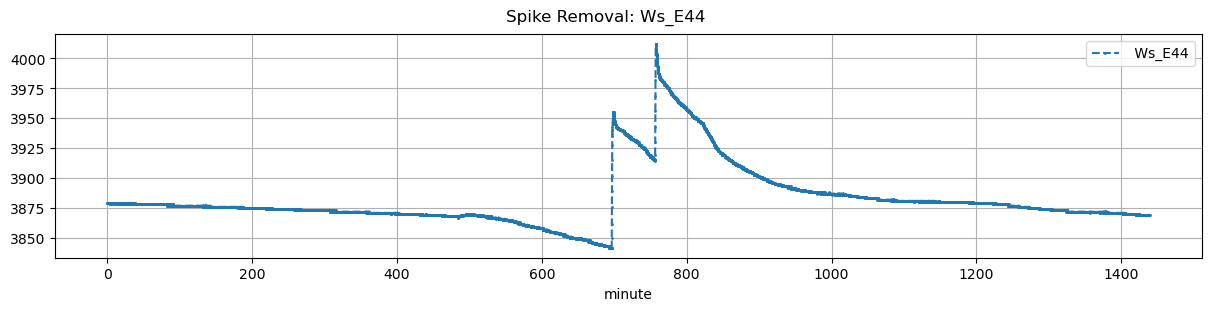
| 2025-12-21 11:36:03+08:00 | 76 | 696 | Ws_E44 | 0.247981 | 30 | 696.05 | 696.500000 | 696.62 | 698.166667 | NaN | NaN | NaN | 3842.0 | 3955.0 | 34 | -0.012361 | -0.112917 | -0.034028 | 0.371667 | 0.664706 | 22.6 | 27.0 | 92.8 | 22.6 | 0.0 | 2.543858 | NaN | 2.543858 |
| 2025-12-21 12:36:03+08:00 | 76 | 756 | Ws_E44 | 0.247981 | 30 | 756.05 | 756.416667 | 756.62 | 757.666667 | NaN | NaN | NaN | 3917.0 | 4012.0 | 34 | -0.044306 | -0.204861 | -0.057341 | 0.398333 | 0.558824 | 19.0 | 22.0 | 62.8 | 19.0 | 0.0 | 5.833055 | 3982.834725 | 5.833055 |