VI and VO Daily Summary
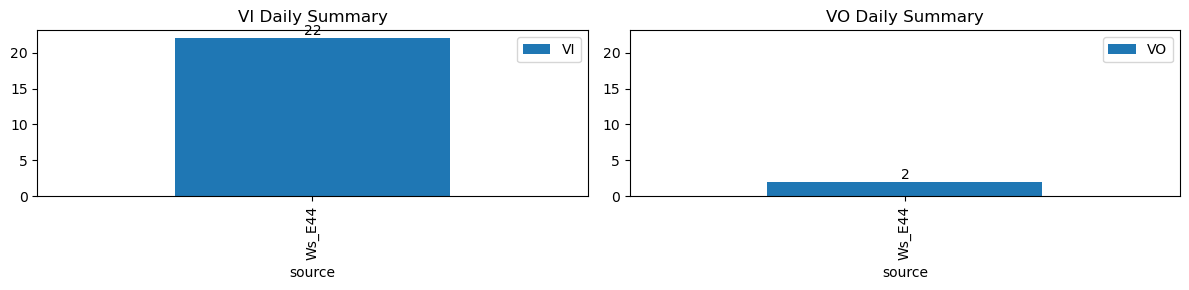
| ws_name | total_dp | nan_dp | nan_filled_dp | long_gap_dp | num_spike |
|---|---|---|---|---|---|
| Ws_E44 | 17269 | 0 | 14665 | 0 | 0 |
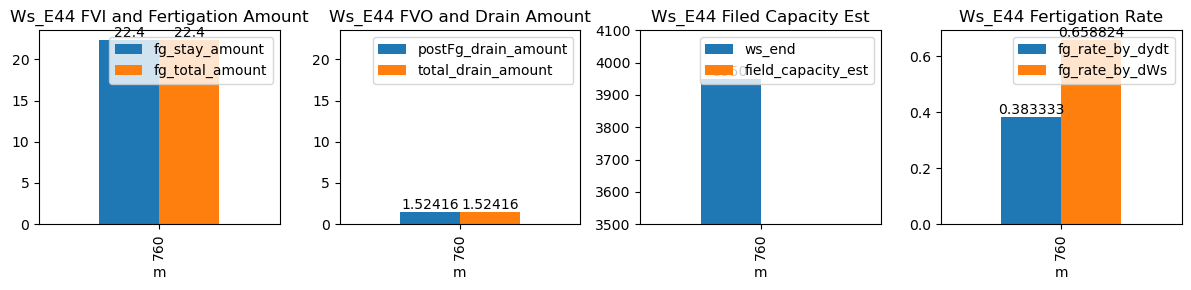
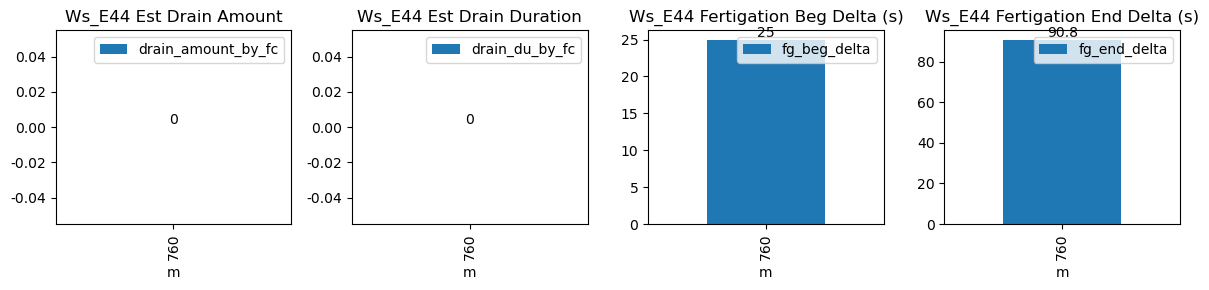
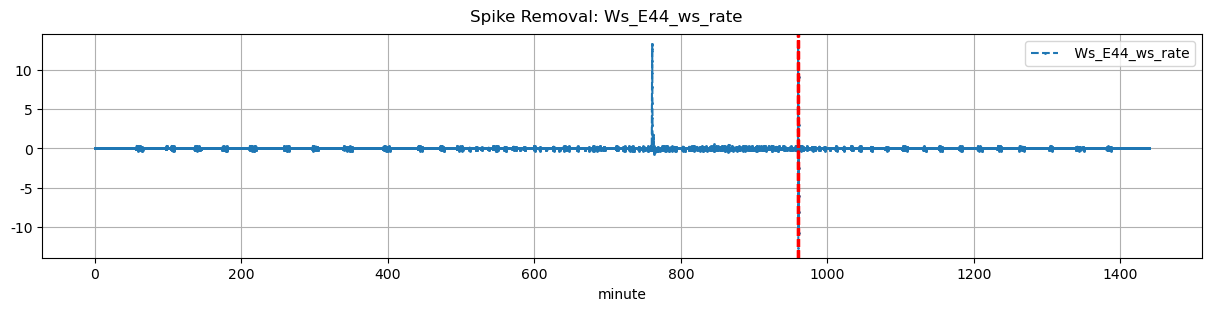
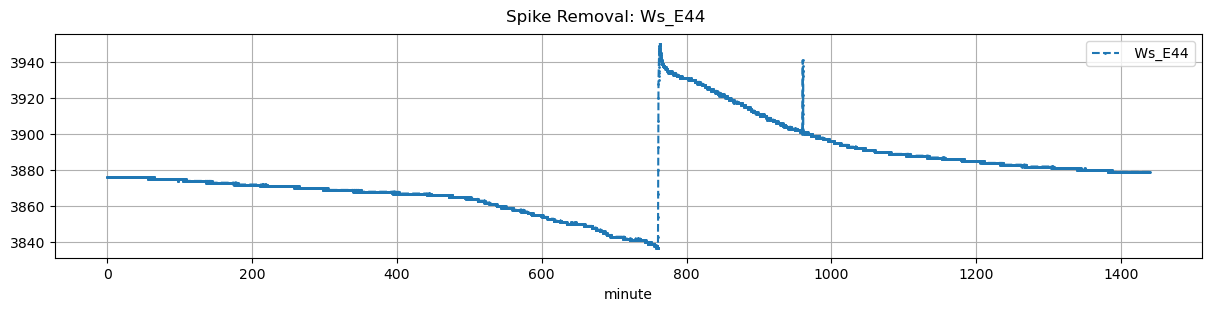
| ds | d | m | ws_name | prominence_cut | max_drain_du | fg_beg | fg_beg_est | fg_end | fg_end_est | drain_amount_by_fc | drain_du_by_fc | drain_rate_by_fc | ws_beg | ws_end | duc | pre_fg_et | post_fg_ws | post_drn_et | fg_rate_by_dydt | fg_rate_by_dWs | fg_stay_amount | fg_beg_delta | fg_end_delta | fg_total_amount | fg_drain_amount | postFg_drain_amount | field_capacity_est | total_drain_amount |
|---|---|---|---|---|---|---|---|---|---|---|---|---|---|---|---|---|---|---|---|---|---|---|---|---|---|---|---|---|
| 2025-12-20 12:40:00+08:00 | 75 | 760 | Ws_E44 | 0.376195 | 30 | 760.0 | 760.416667 | 760.57 | 762.083333 | NaN | NaN | NaN | 3838.0 | 3950.0 | 34 | -0.021893 | -0.109861 | -0.013958 | 0.383333 | 0.658824 | 22.4 | 25.0 | 90.8 | 22.4 | 0.0 | 1.524162 | NaN | 1.524162 |