| 2025-12-19 09:46:03+08:00 |
74 |
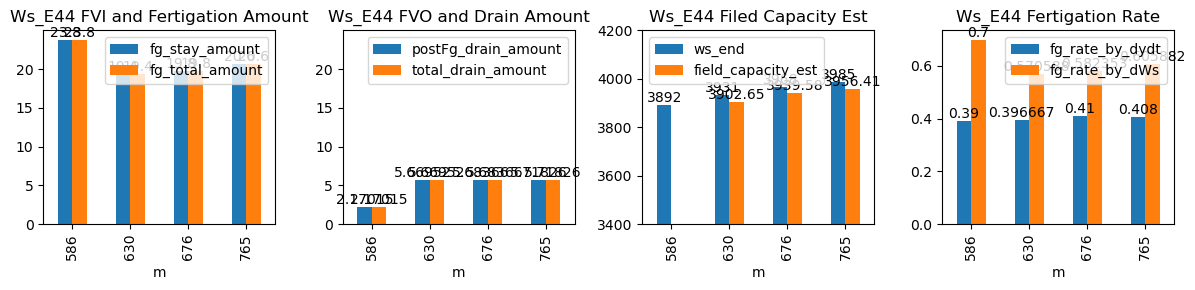
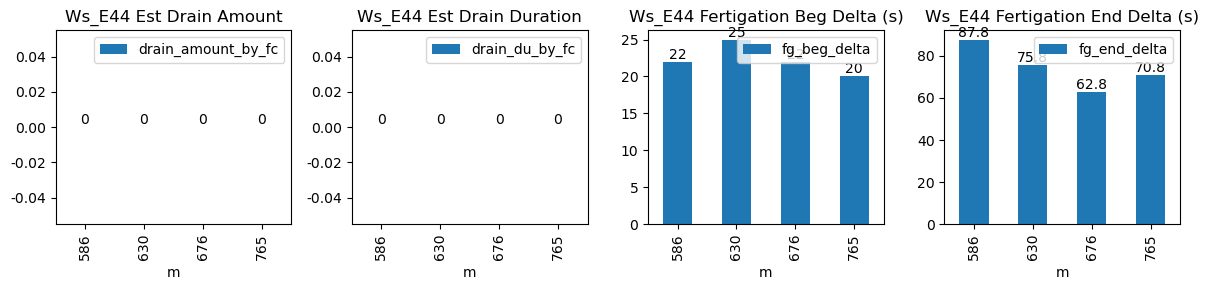
586 |
Ws_E44 |
0.35056 |
30 |
586.05 |
586.416667 |
586.62 |
588.083333 |
NaN |
NaN |
NaN |
3773.0 |
3892.0 |
34 |
-0.028611 |
-0.154861 |
-0.120516 |
0.390000 |
0.700000 |
23.8 |
22.0 |
87.8 |
23.8 |
0.0 |
2.170155 |
NaN |
2.170155 |
| 2025-12-19 10:30:00+08:00 |
74 |
630 |
Ws_E44 |
0.35056 |
30 |
630.00 |
630.416667 |
630.57 |
631.833333 |
NaN |
NaN |
NaN |
3834.0 |
3931.0 |
34 |
-0.109181 |
-0.243194 |
-0.039028 |
0.396667 |
0.570588 |
19.4 |
25.0 |
75.8 |
19.4 |
0.0 |
5.669517 |
3902.652416 |
5.669517 |
| 2025-12-19 11:16:03+08:00 |
74 |
676 |
Ws_E44 |
0.35056 |
30 |
676.05 |
676.416667 |
676.62 |
677.666667 |
NaN |
NaN |
NaN |
3869.0 |
3968.0 |
34 |
-0.045556 |
-0.212361 |
-0.069153 |
0.410000 |
0.582353 |
19.8 |
22.0 |
62.8 |
19.8 |
0.0 |
5.683665 |
3939.581675 |
5.683665 |
| 2025-12-19 12:45:00+08:00 |
74 |
765 |
Ws_E44 |
0.35056 |
30 |
765.00 |
765.333333 |
765.57 |
766.750000 |
NaN |
NaN |
NaN |
3882.0 |
3985.0 |
34 |
-0.039407 |
-0.201806 |
-0.047500 |
0.408000 |
0.605882 |
20.6 |
20.0 |
70.8 |
20.6 |
0.0 |
5.718257 |
3956.408713 |
5.718257 |