| 2025-12-31 09:45:00+08:00 |
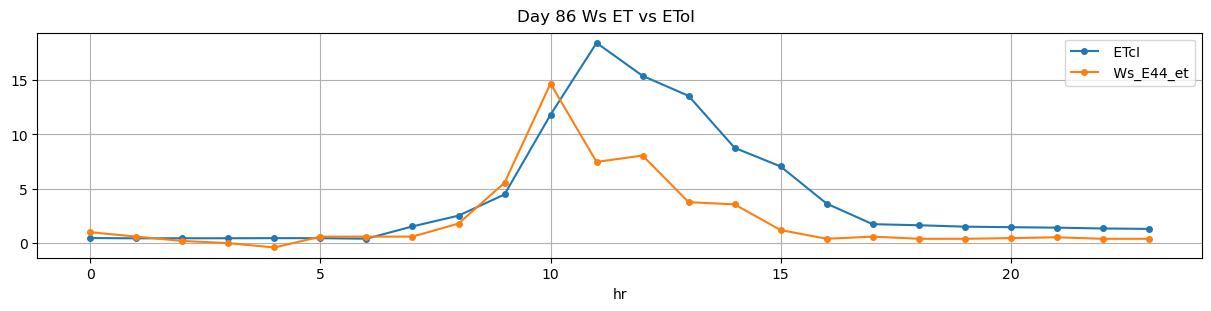
86 |
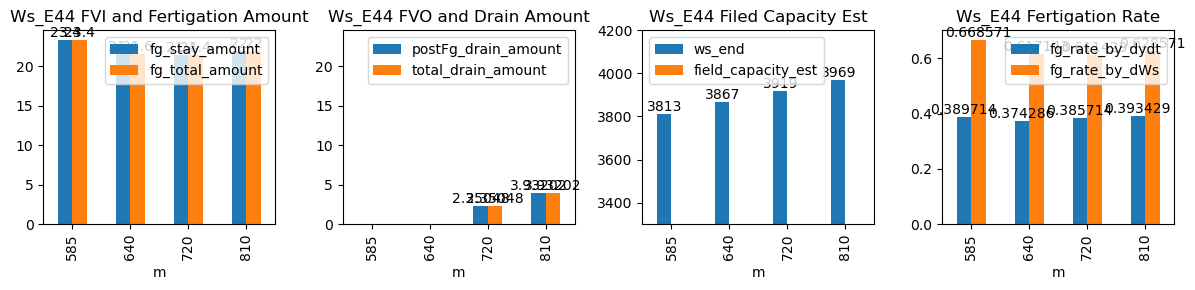
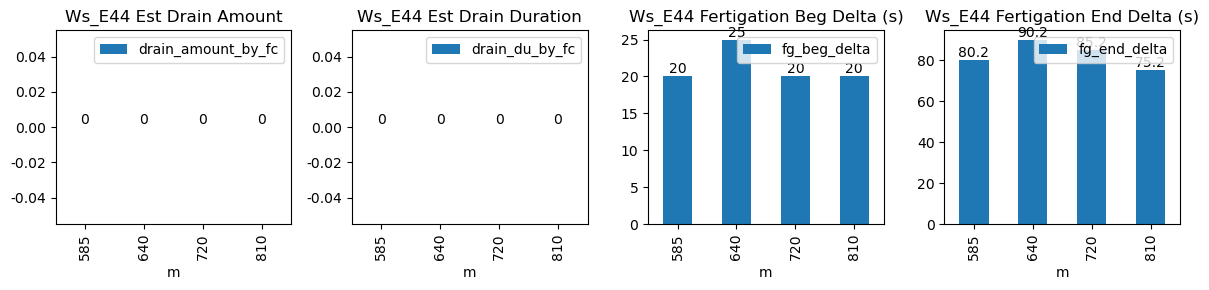
585 |
Ws_E44 |
0.292752 |
30 |
585.0 |
585.333333 |
585.58 |
586.916667 |
NaN |
NaN |
NaN |
3696.0 |
3813.0 |
35 |
-0.048023 |
-0.034028 |
-0.080407 |
0.389714 |
0.668571 |
23.4 |
20.0 |
80.2 |
23.4 |
0.0 |
-1.852956 |
NaN |
-1.852956 |
| 2025-12-31 10:40:00+08:00 |
86 |
640 |
Ws_E44 |
0.292752 |
30 |
640.0 |
640.416667 |
640.58 |
642.083333 |
NaN |
NaN |
NaN |
3759.0 |
3867.0 |
35 |
-0.222760 |
-0.109444 |
-0.040694 |
0.374286 |
0.617143 |
21.6 |
25.0 |
90.2 |
21.6 |
0.0 |
-0.594145 |
NaN |
-0.594145 |
| 2025-12-31 12:00:00+08:00 |
86 |
720 |
Ws_E44 |
0.292752 |
30 |
720.0 |
720.333333 |
720.58 |
722.000000 |
NaN |
NaN |
NaN |
3812.0 |
3919.0 |
35 |
-0.068136 |
-0.122361 |
-0.042639 |
0.385714 |
0.611429 |
21.4 |
20.0 |
85.2 |
21.4 |
0.0 |
2.350484 |
NaN |
2.350484 |
| 2025-12-31 13:30:00+08:00 |
86 |
810 |
Ws_E44 |
0.292752 |
30 |
810.0 |
810.333333 |
810.58 |
811.833333 |
NaN |
NaN |
NaN |
3859.0 |
3969.0 |
35 |
-0.020541 |
-0.159444 |
-0.035972 |
0.393429 |
0.628571 |
22.0 |
20.0 |
75.2 |
22.0 |
0.0 |
3.932024 |
NaN |
3.932024 |