| 2025-12-30 08:36:05+08:00 |
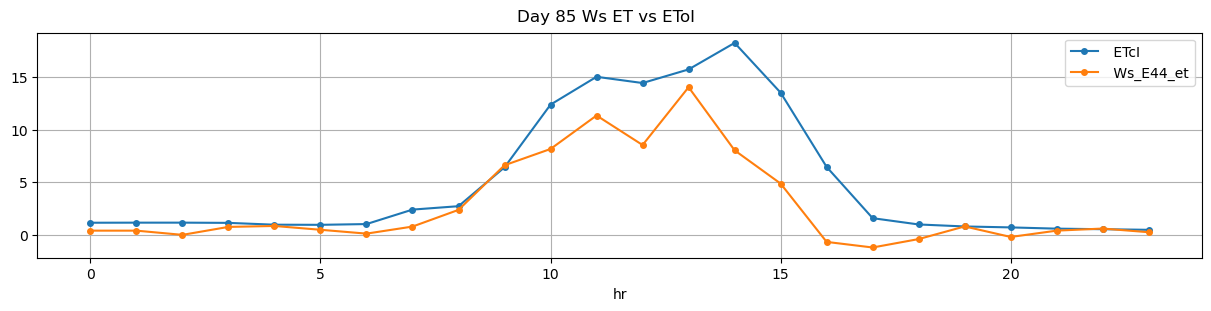
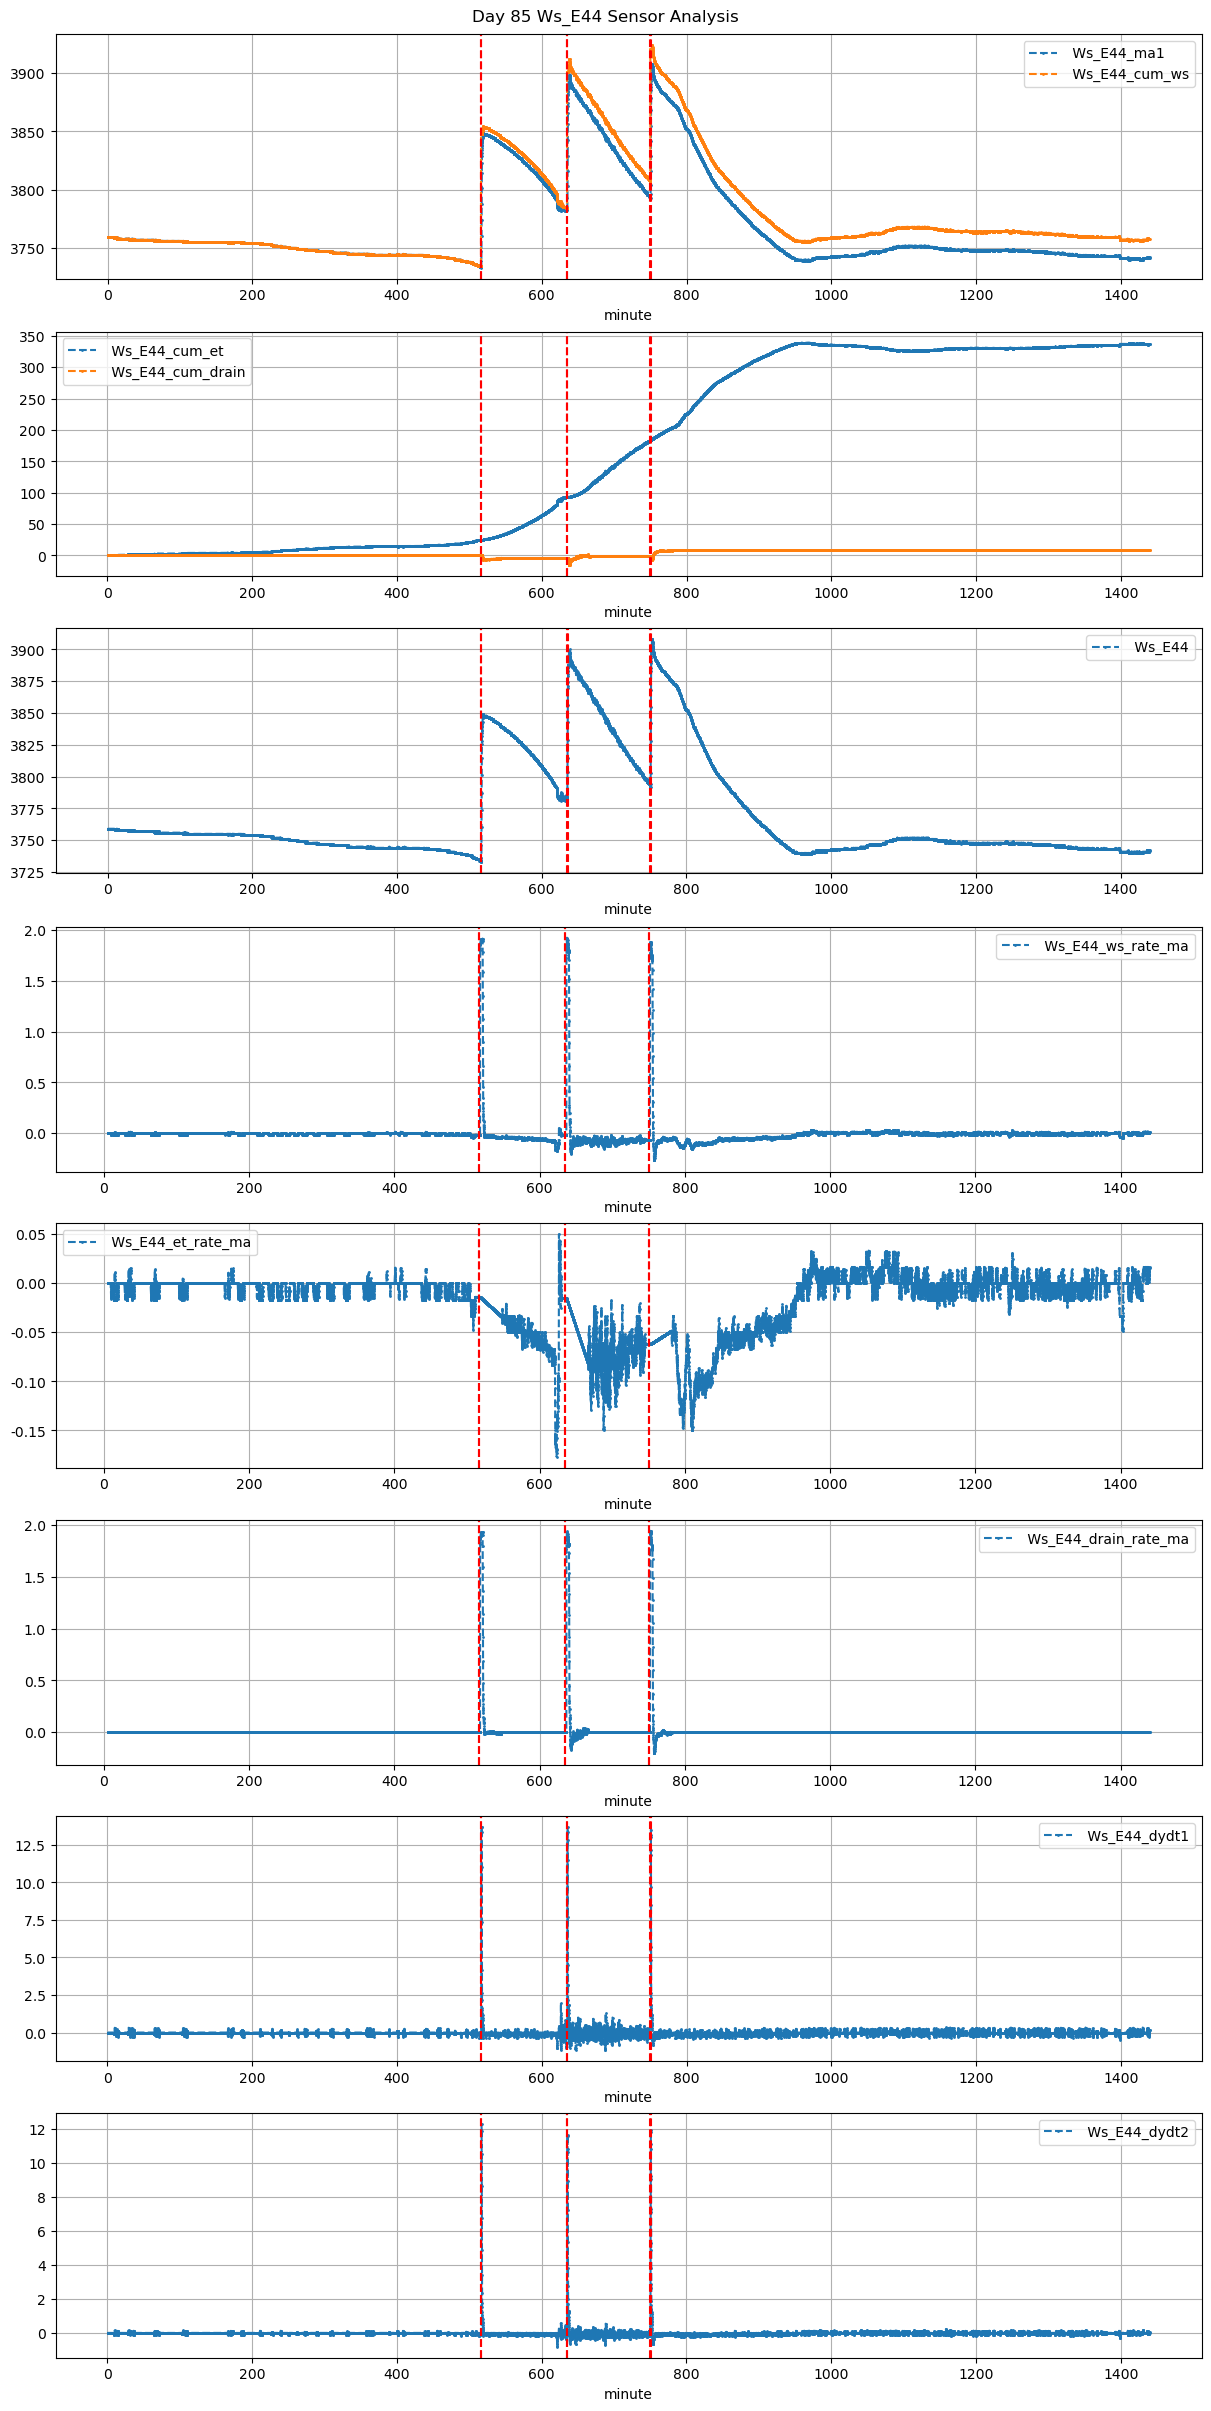
85 |
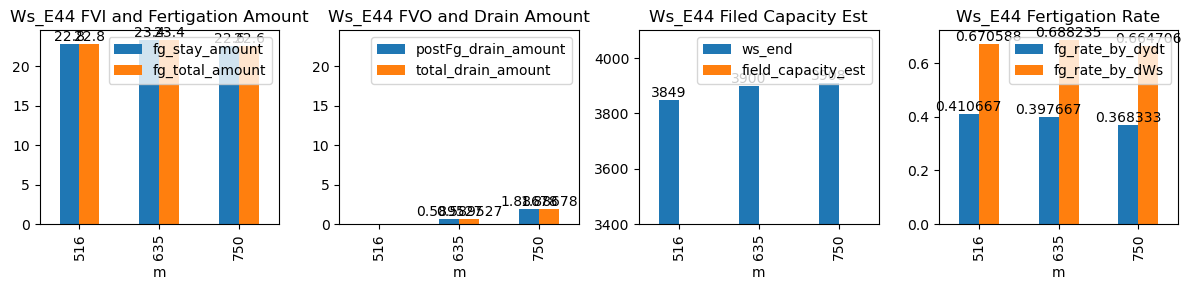
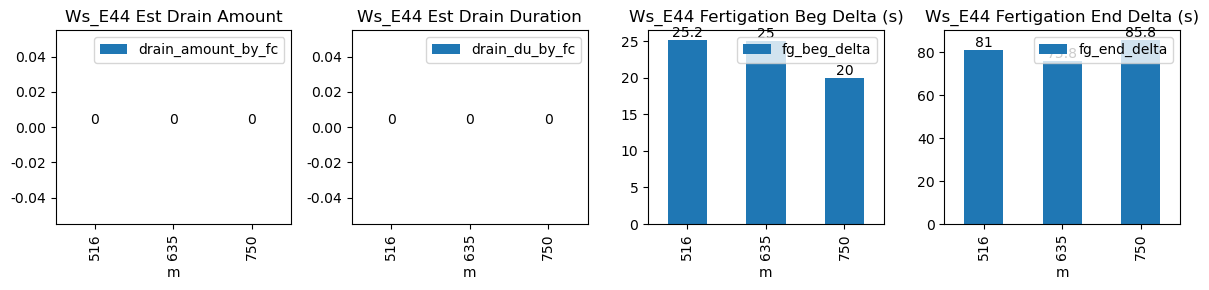
516 |
Ws_E44 |
0.309784 |
30 |
516.08 |
516.500000 |
516.65 |
518.000000 |
NaN |
NaN |
NaN |
3735.0 |
3849.0 |
34 |
-0.017639 |
-0.013889 |
-0.034306 |
0.410667 |
0.670588 |
22.8 |
25.2 |
81.0 |
22.8 |
0.0 |
-0.804274 |
NaN |
-0.804274 |
| 2025-12-30 10:35:00+08:00 |
85 |
635 |
Ws_E44 |
0.309784 |
30 |
635.00 |
635.416667 |
635.57 |
636.833333 |
NaN |
NaN |
NaN |
3783.0 |
3900.0 |
34 |
-0.014925 |
-0.108056 |
-0.082407 |
0.397667 |
0.688235 |
23.4 |
25.0 |
75.8 |
23.4 |
0.0 |
0.589527 |
NaN |
0.589527 |
| 2025-12-30 12:30:00+08:00 |
85 |
750 |
Ws_E44 |
0.309784 |
30 |
750.00 |
750.333333 |
750.57 |
752.000000 |
NaN |
NaN |
NaN |
3795.0 |
3908.0 |
34 |
-0.062288 |
-0.156667 |
-0.048155 |
0.368333 |
0.664706 |
22.6 |
20.0 |
85.8 |
22.6 |
0.0 |
1.886778 |
NaN |
1.886778 |