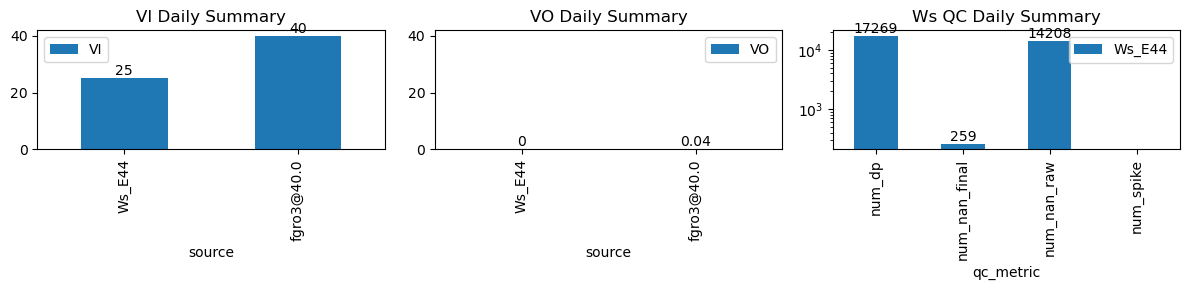
VI and VO Daily Summary
| ws_name | num_dp | num_nan_raw | num_nan_final | num_spike | cum_step_adj |
|---|---|---|---|---|---|
| Ws_E44 | 17,269 | 14,208 | 259 | 0 | 0.00 |
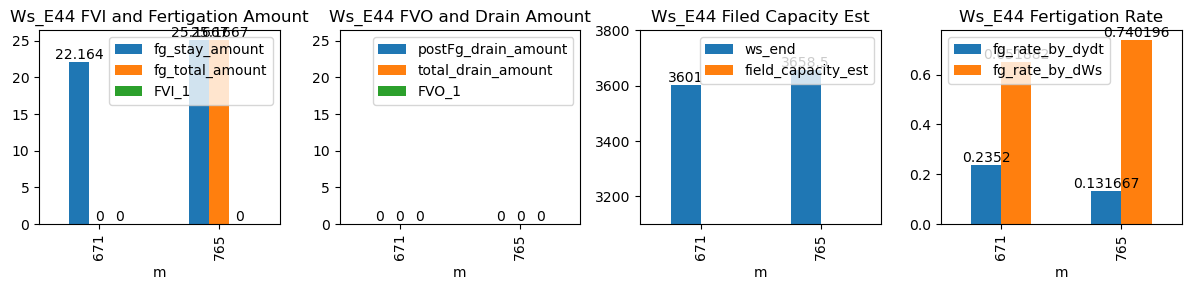
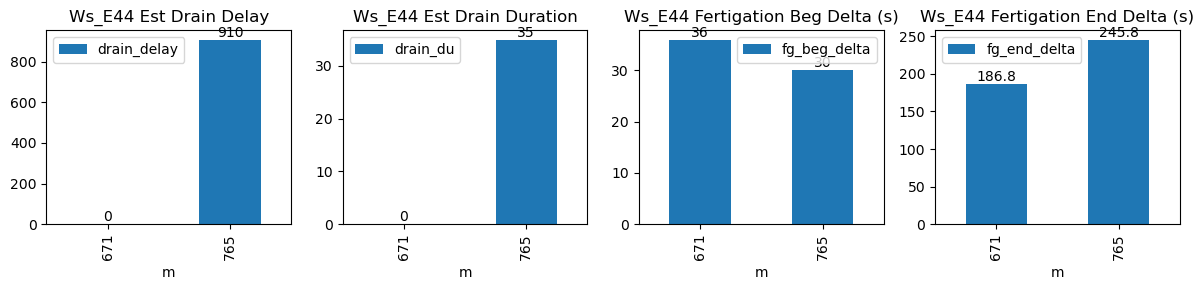
| ds | d | m | ws_name | prominence_cut | max_drain_du | fg_beg | fg_beg_est | fg_end | fg_end_est | ws_beg | ws_end | duc | pre_fg_et | post_fg_ws | post_drn_et | fg_rate_by_dydt | fg_rate_by_dWs | fg_stay_amount | enough_data | fg_beg_delta | fg_end_delta | fg_total_amount | fg_drain_amount | postFg_drain_amount | total_drain_amount | drain_du | drain_delay | drain_rate | field_capacity_est | FVI_1 | FVO_1 |
|---|---|---|---|---|---|---|---|---|---|---|---|---|---|---|---|---|---|---|---|---|---|---|---|---|---|---|---|---|---|---|---|
| 2026-01-05 11:11:09+08:00 | 91 | 671 | Ws_E44 | 0.320307 | 30 | 671.15 | 671.75 | 671.72 | 674.833333 | 3490.180000 | 3601.0 | 34 | -0.045243 | -0.000802 | -0.045243 | 0.235200 | 0.651882 | 22.164000 | False | 36.0 | 186.8 | NaN | 0.0 | 0.0 | 0.0 | NaN | NaN | NaN | NaN | NaN | NaN |
| 2026-01-05 12:45:00+08:00 | 91 | 765 | Ws_E44 | 0.320307 | 30 | 765.00 | 765.50 | 765.57 | 769.666667 | 3532.666667 | 3658.5 | 34 | -0.175355 | -0.010052 | -0.033115 | 0.131667 | 0.740196 | 25.166667 | True | 30.0 | 245.8 | 25.166667 | 0.0 | 0.0 | 0.0 | 35.0 | 910.0 | -0.026151 | NaN | NaN | NaN |