| 2026-01-06 09:45:00+08:00 |
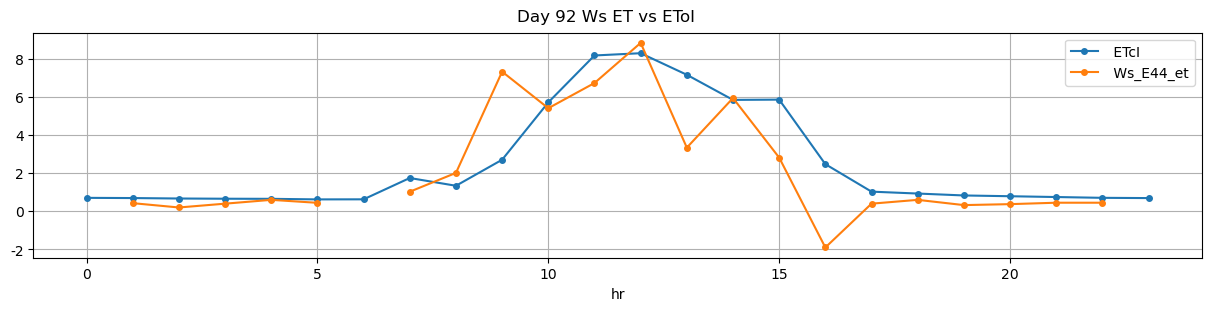
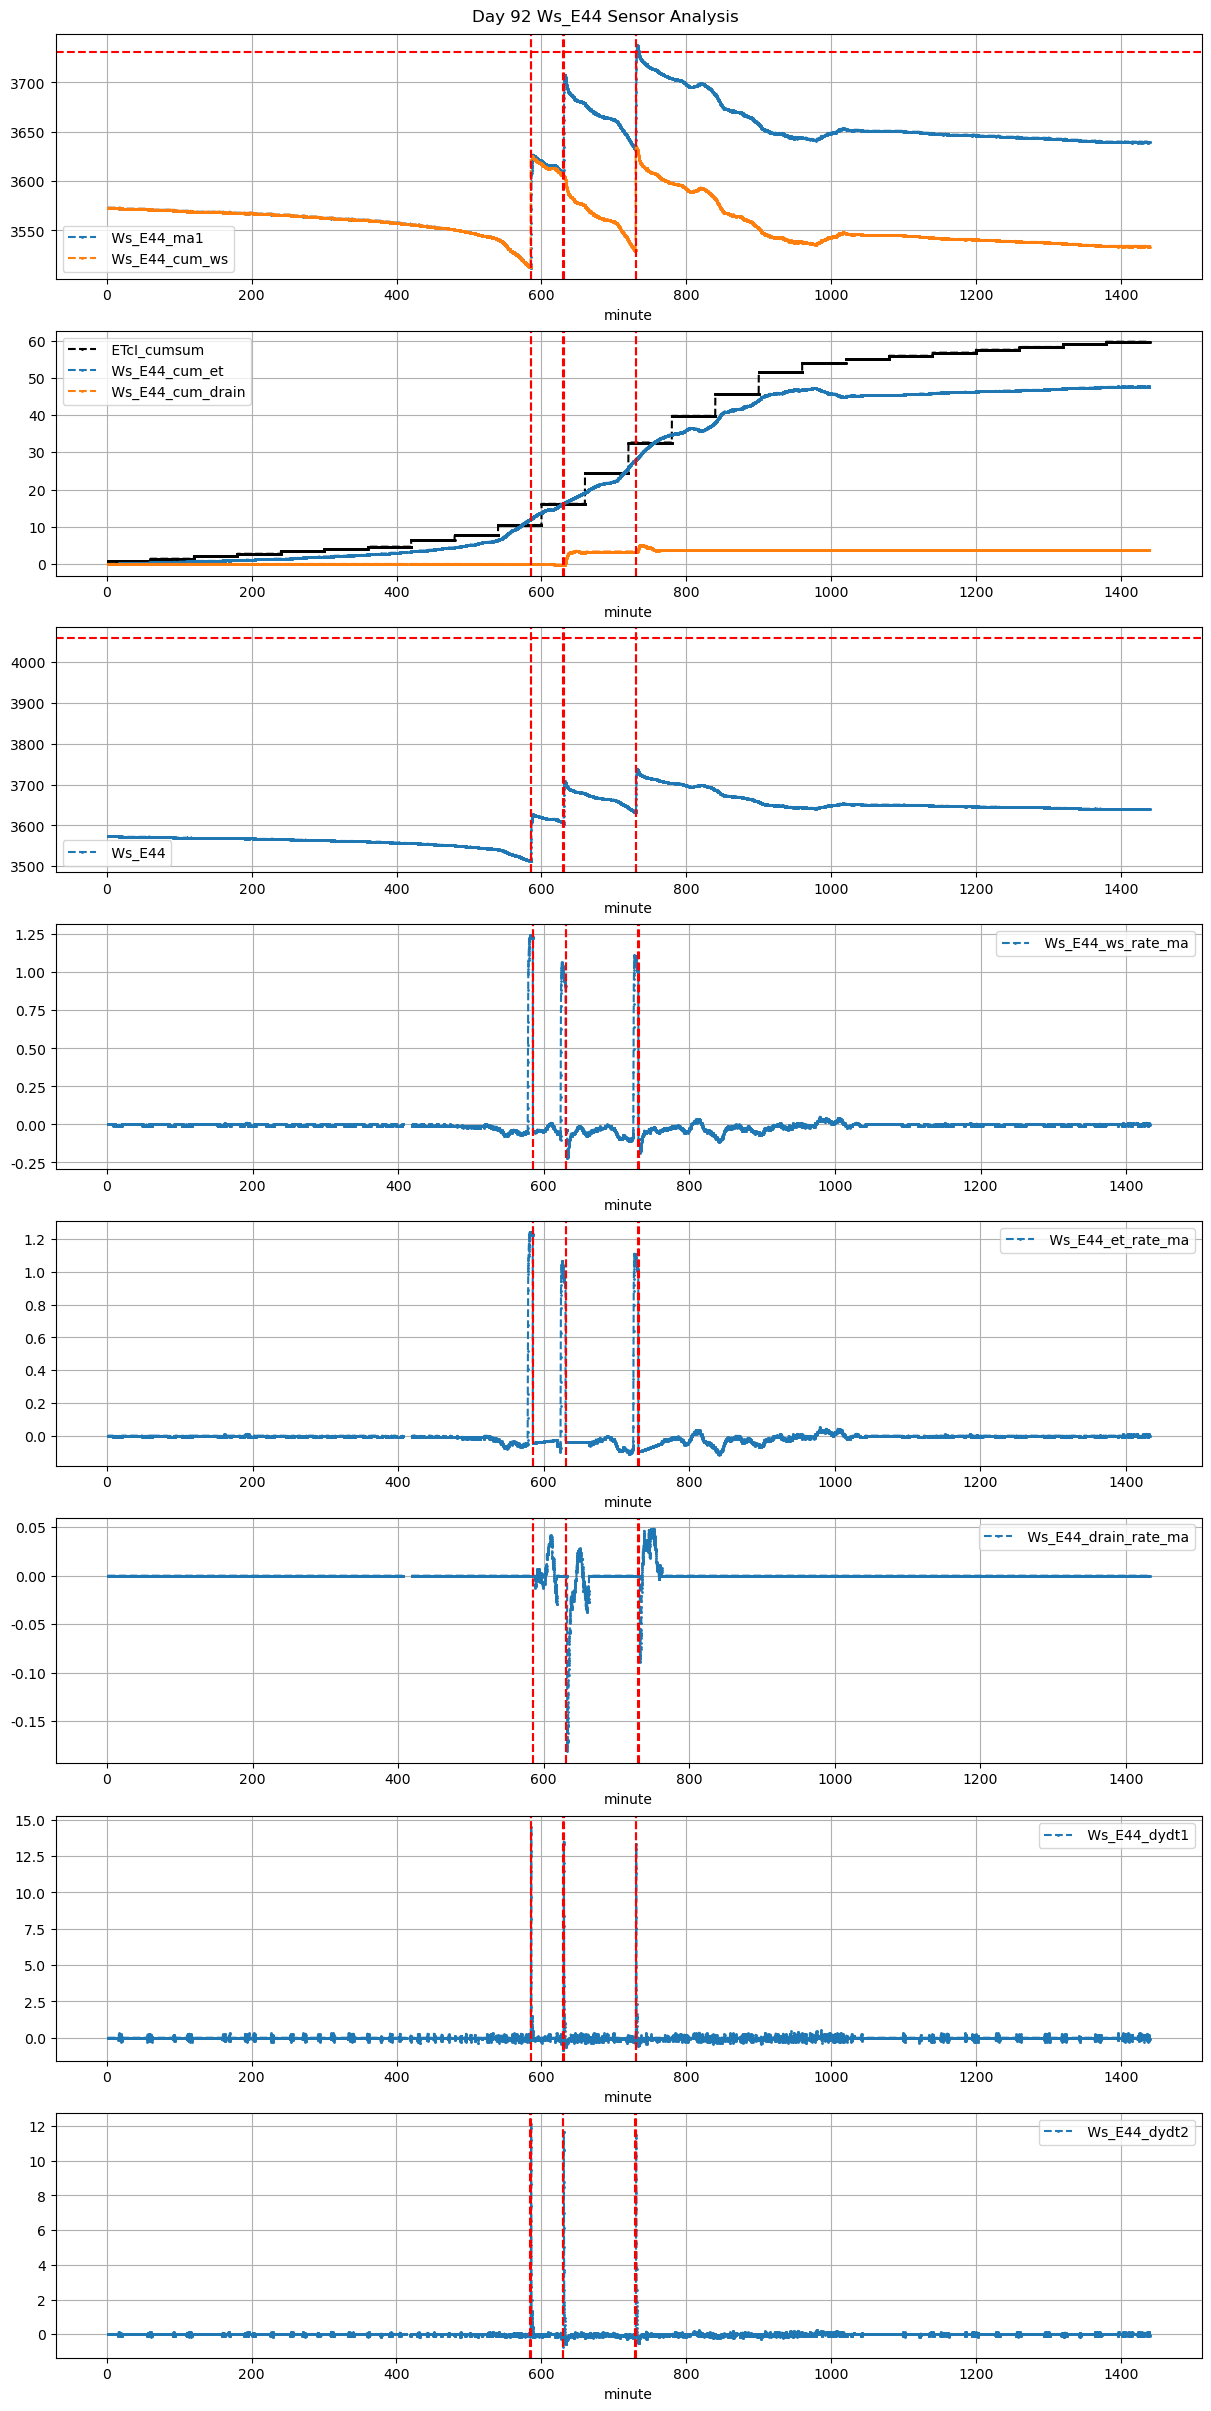
92 |
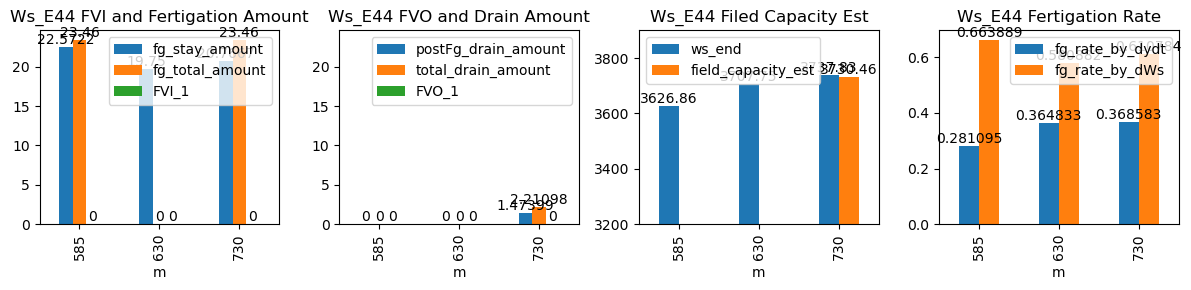
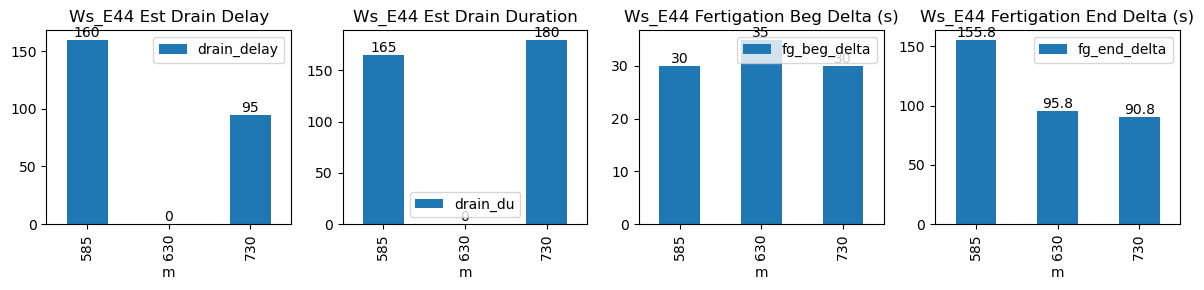
585 |
Ws_E44 |
0.233721 |
30 |
585.0 |
585.500000 |
585.57 |
588.166667 |
3514.0 |
3626.861111 |
34 |
-0.054637 |
-0.042269 |
-0.026584 |
0.281095 |
0.663889 |
22.572222 |
True |
30.0 |
155.8 |
23.46 |
0.000000 |
0.000000 |
0.000000 |
165.0 |
160.0 |
-0.010613 |
NaN |
NaN |
NaN |
| 2026-01-06 10:30:00+08:00 |
92 |
630 |
Ws_E44 |
0.233721 |
30 |
630.0 |
630.583333 |
630.57 |
632.166667 |
3609.0 |
3707.750000 |
34 |
-0.039695 |
-0.113846 |
-0.039695 |
0.364833 |
0.580882 |
19.750000 |
False |
35.0 |
95.8 |
NaN |
NaN |
NaN |
NaN |
NaN |
NaN |
NaN |
NaN |
NaN |
NaN |
| 2026-01-06 12:10:00+08:00 |
92 |
730 |
Ws_E44 |
0.233721 |
30 |
730.0 |
730.500000 |
730.57 |
732.083333 |
3634.0 |
3737.833333 |
34 |
-0.097706 |
-0.096478 |
-0.046444 |
0.368583 |
0.610784 |
20.766667 |
True |
30.0 |
90.8 |
23.46 |
0.736994 |
1.473989 |
2.210983 |
180.0 |
95.0 |
-0.085919 |
3730.46339 |
NaN |
NaN |