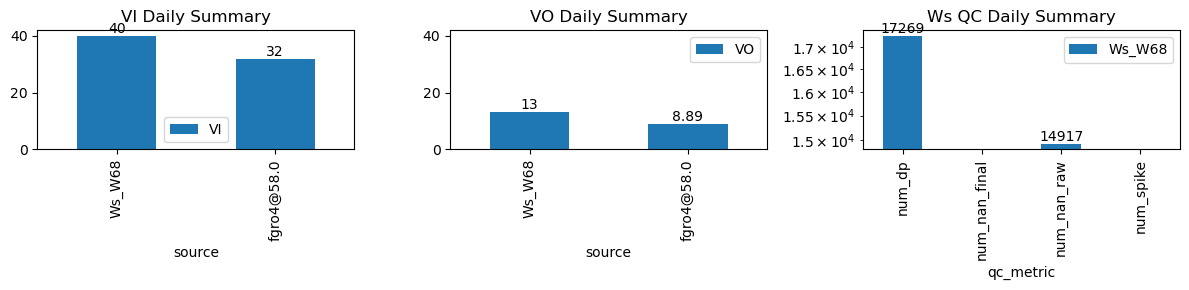
VI and VO Daily Summary
| ws_name | num_dp | num_nan_raw | num_nan_final | num_spike | cum_step_adj |
|---|---|---|---|---|---|
| Ws_W68 | 17,269 | 14,917 | 0 | 0 | 0.00 |
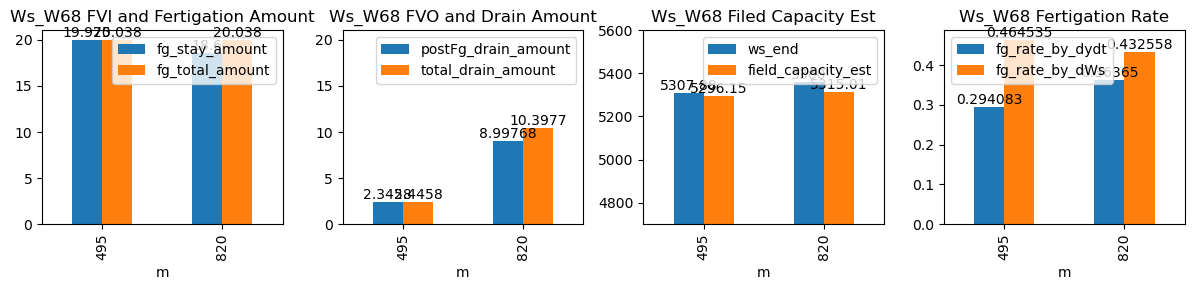
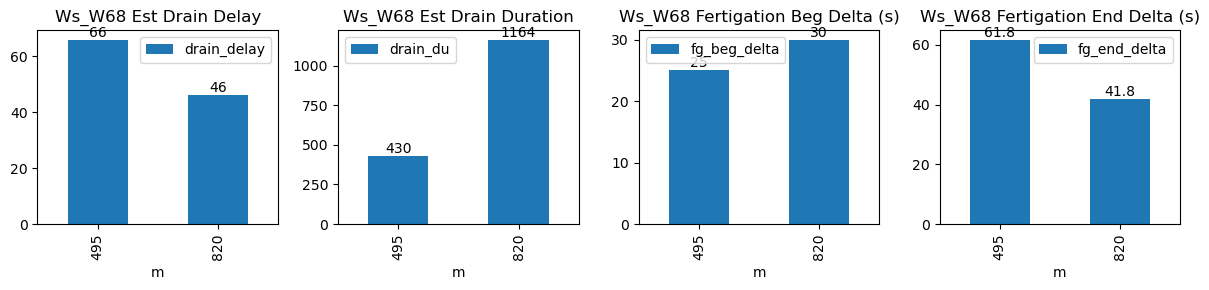
| ds | d | m | ws_name | prominence_cut | max_drain_du | fg_beg | fg_beg_est | fg_end | fg_end_est | ws_beg | ws_end | duc | pre_fg_et | post_fg_ws | post_drn_et | fg_rate_by_dydt | fg_rate_by_dWs | fg_stay_amount | enough_data | fg_beg_delta | fg_end_delta | fg_total_amount | fg_drain_amount | postFg_drain_amount | total_drain_amount | drain_du | drain_delay | drain_rate | field_capacity_est |
|---|---|---|---|---|---|---|---|---|---|---|---|---|---|---|---|---|---|---|---|---|---|---|---|---|---|---|---|---|---|
| 2026-01-26 08:15:00+08:00 | 112 | 495 | Ws_W68 | 0.696641 | 30 | 495.0 | 495.416667 | 495.72 | 496.750000 | 5208.0 | 5307.875 | 43 | -0.005195 | -0.039556 | -0.014012 | 0.294083 | 0.464535 | 19.975 | True | 25.0 | 61.8 | 20.038 | 0.1 | 2.345805 | 2.445805 | 430 | 66 | -0.053331 | 5296.145976 |
| 2026-01-26 13:40:00+08:00 | 112 | 820 | Ws_W68 | 0.696641 | 30 | 820.0 | 820.500000 | 820.72 | 821.416667 | 5267.0 | 5360.000 | 43 | -0.005849 | -0.095309 | -0.018052 | 0.363650 | 0.432558 | 18.600 | True | 30.0 | 41.8 | 20.038 | 1.4 | 8.997680 | 10.397680 | 1164 | 46 | -0.123724 | 5315.011600 |