| 2026-01-27 11:00:00+08:00 |
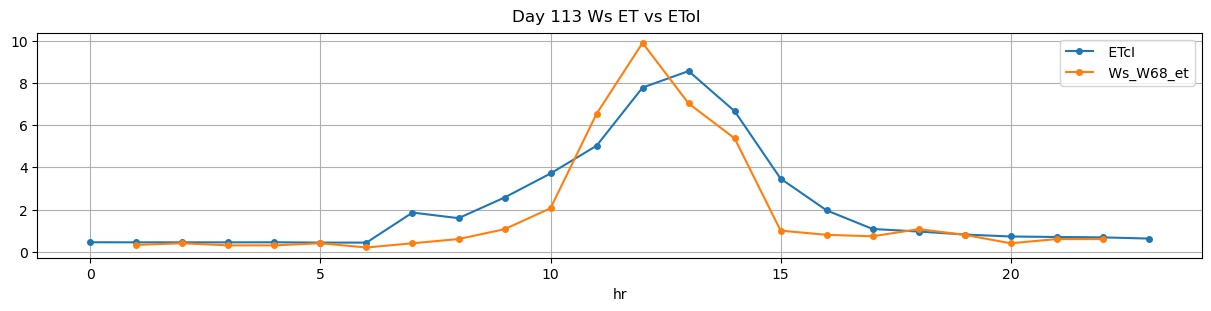
113 |
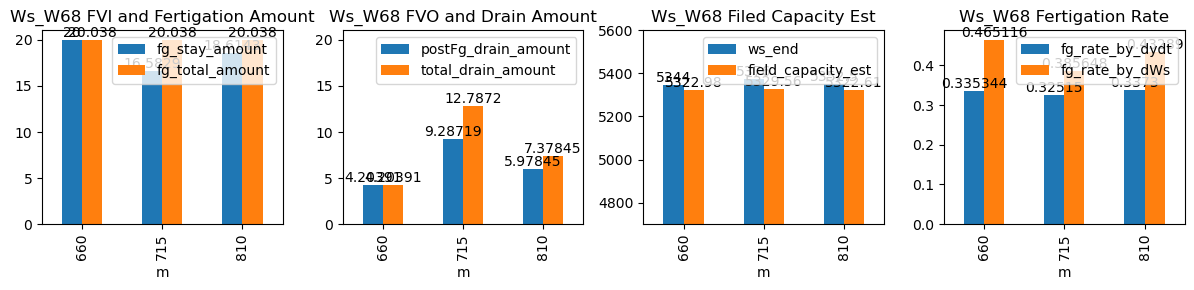
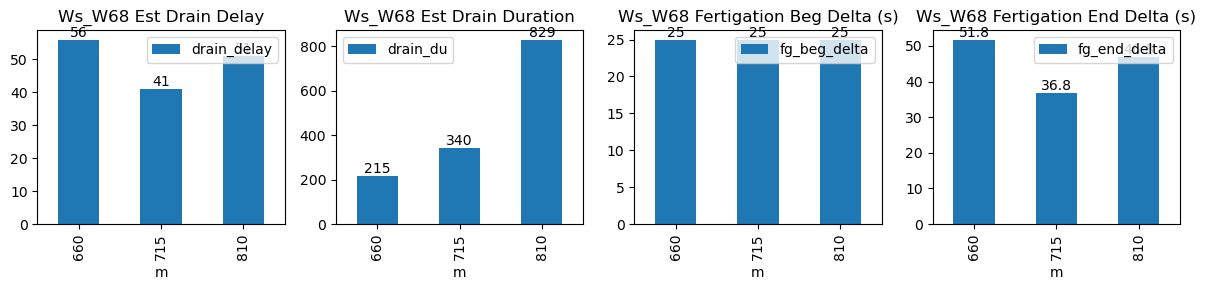
660 |
Ws_W68 |
0.863768 |
30 |
660.0 |
660.416667 |
660.72 |
661.583333 |
5244.000000 |
5344.0 |
43 |
-0.019569 |
-0.063617 |
-0.051540 |
0.335344 |
0.465116 |
20.000000 |
True |
25.0 |
51.8 |
20.038 |
0.0 |
4.203907 |
4.203907 |
215 |
56 |
-0.087490 |
5322.980464 |
| 2026-01-27 11:55:00+08:00 |
113 |
715 |
Ws_W68 |
0.863768 |
30 |
715.0 |
715.416667 |
715.72 |
716.333333 |
5293.085714 |
5376.0 |
43 |
-0.057133 |
-0.136718 |
-0.112416 |
0.325150 |
0.385648 |
16.582857 |
True |
25.0 |
36.8 |
20.038 |
3.5 |
9.287190 |
12.787190 |
340 |
41 |
-0.156513 |
5329.564049 |
| 2026-01-27 13:30:00+08:00 |
113 |
810 |
Ws_W68 |
0.863768 |
30 |
810.0 |
810.416667 |
810.72 |
811.500000 |
5259.428571 |
5352.5 |
43 |
-0.054312 |
-0.110802 |
-0.040880 |
0.337300 |
0.432890 |
18.614286 |
True |
25.0 |
46.8 |
20.038 |
1.4 |
5.978453 |
7.378453 |
829 |
51 |
-0.088498 |
5322.607736 |