| 2026-02-02 09:40:00+08:00 |
119 |
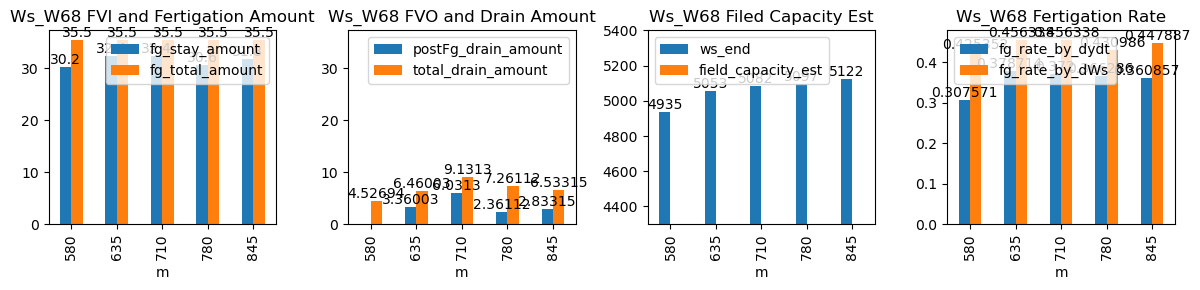
580 |
Ws_W68 |
1.0121 |
30 |
580.0 |
580.083333 |
581.18 |
582.500000 |
NaN |
NaN |
NaN |
4784.0 |
4935.0 |
71 |
-0.056080 |
0.000000 |
-0.093528 |
0.307571 |
0.425352 |
30.2 |
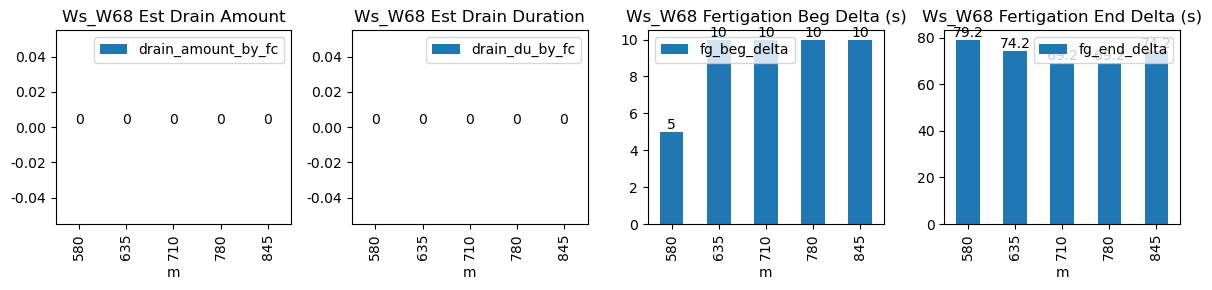
5.0 |
79.2 |
35.5 |
5.3 |
-0.773063 |
NaN |
4.526937 |
| 2026-02-02 10:35:00+08:00 |
119 |
635 |
Ws_W68 |
1.0121 |
30 |
635.0 |
635.166667 |
636.18 |
637.416667 |
NaN |
NaN |
NaN |
4891.0 |
5053.0 |
71 |
-0.090517 |
-0.175694 |
-0.146962 |
0.378714 |
0.456338 |
32.4 |
10.0 |
74.2 |
35.5 |
3.1 |
3.360034 |
NaN |
6.460034 |
| 2026-02-02 11:50:00+08:00 |
119 |
710 |
Ws_W68 |
1.0121 |
30 |
710.0 |
710.166667 |
711.18 |
712.333333 |
NaN |
NaN |
NaN |
4920.0 |
5082.0 |
71 |
-0.149576 |
-0.129306 |
-0.075477 |
0.372000 |
0.456338 |
32.4 |
10.0 |
69.2 |
35.5 |
3.1 |
6.031304 |
NaN |
9.131304 |
| 2026-02-02 13:00:00+08:00 |
119 |
780 |
Ws_W68 |
1.0121 |
30 |
780.0 |
780.166667 |
781.18 |
782.333333 |
NaN |
NaN |
NaN |
4944.0 |
5097.0 |
71 |
-0.184752 |
-0.226111 |
-0.175840 |
0.366286 |
0.430986 |
30.6 |
10.0 |
69.2 |
35.5 |
4.9 |
2.361118 |
NaN |
7.261118 |
| 2026-02-02 14:05:00+08:00 |
119 |
845 |
Ws_W68 |
1.0121 |
30 |
845.0 |
845.166667 |
846.18 |
847.416667 |
NaN |
NaN |
NaN |
4963.0 |
5122.0 |
71 |
-0.127439 |
-0.208611 |
-0.172259 |
0.360857 |
0.447887 |
31.8 |
10.0 |
74.2 |
35.5 |
3.7 |
2.833145 |
NaN |
6.533145 |