| 2026-02-01 10:15:00+08:00 |
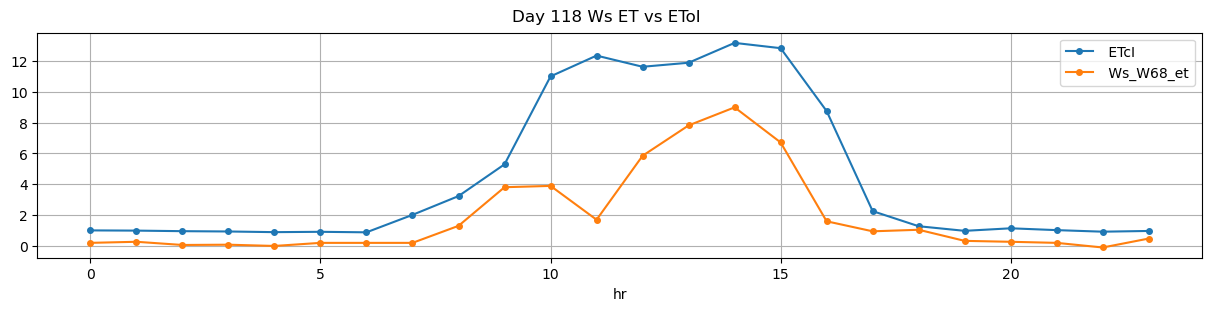
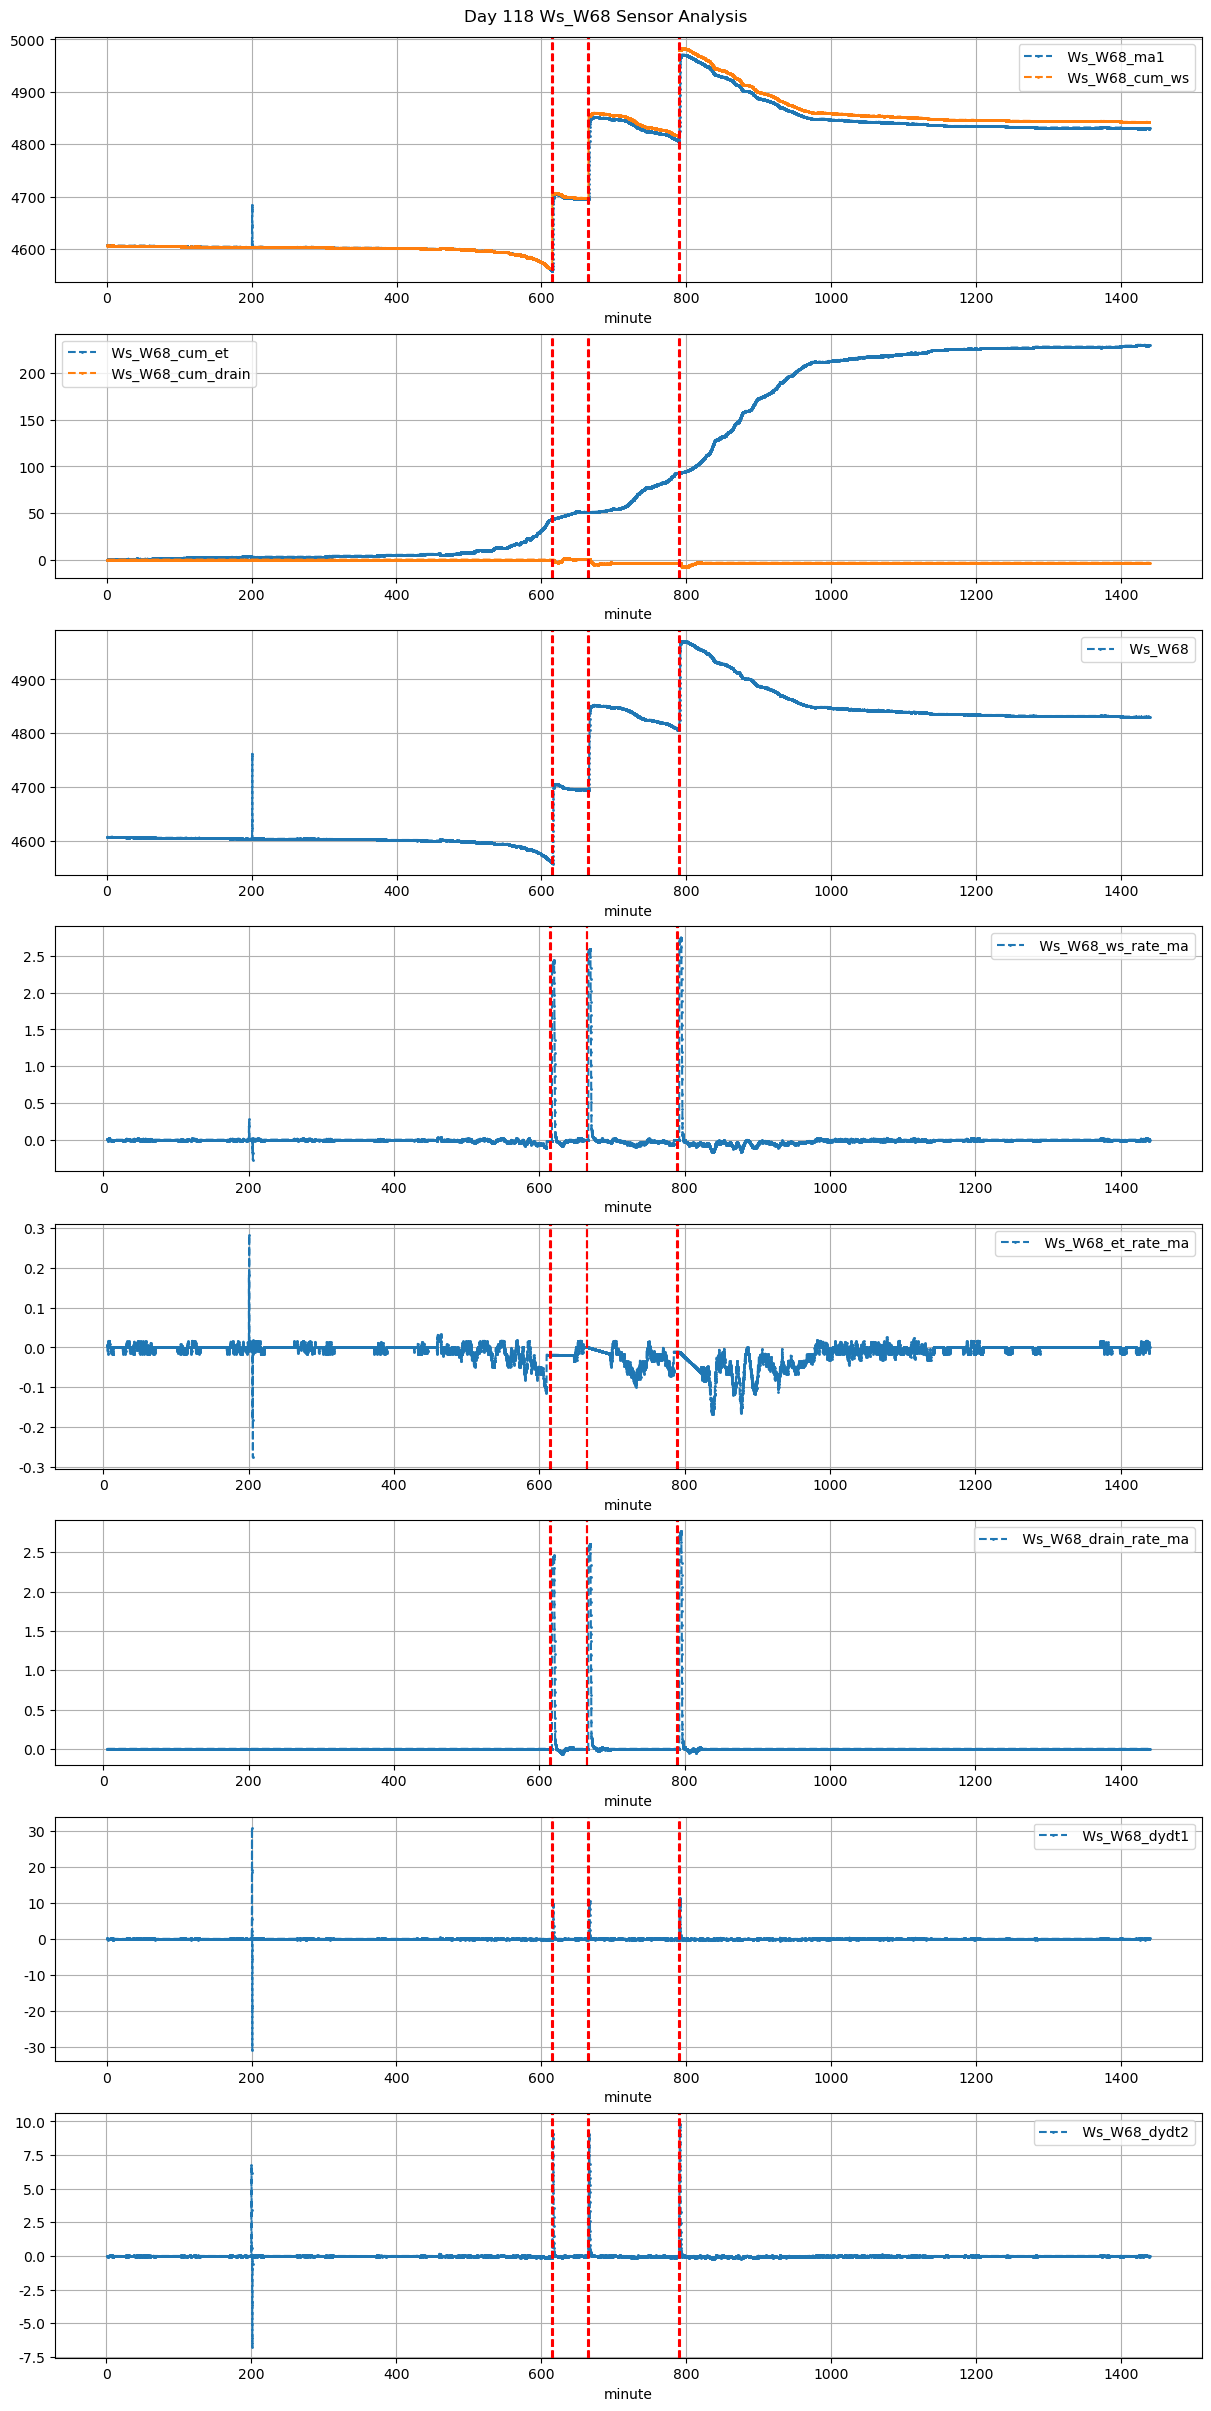
118 |
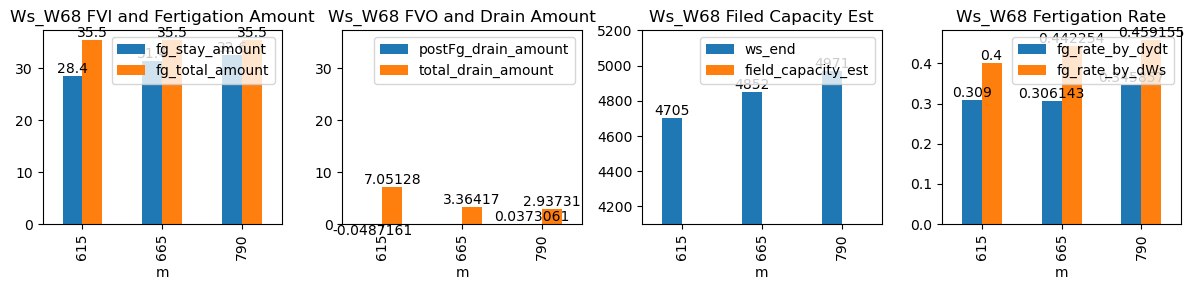
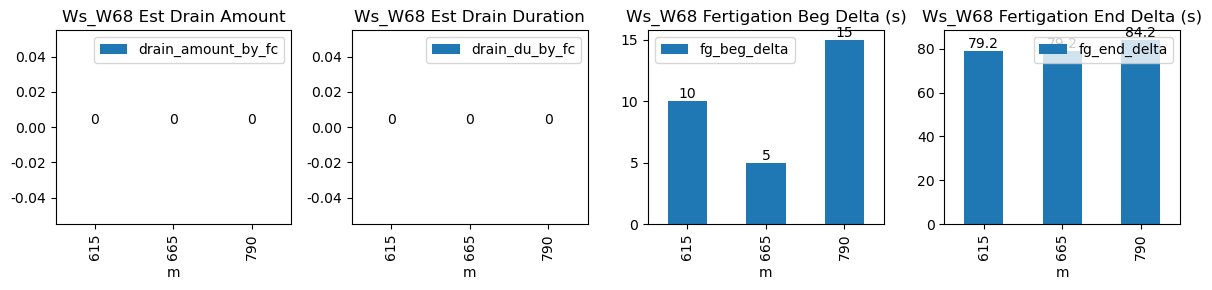
615 |
Ws_W68 |
0.519683 |
30 |
615.0 |
615.166667 |
616.18 |
617.500000 |
NaN |
NaN |
NaN |
4563.0 |
4705.0 |
71 |
-0.095490 |
-0.018333 |
-0.020139 |
0.309000 |
0.400000 |
28.4 |
10.0 |
79.2 |
35.5 |
7.1 |
-0.048716 |
NaN |
7.051284 |
| 2026-02-01 11:05:00+08:00 |
118 |
665 |
Ws_W68 |
0.519683 |
30 |
665.0 |
665.083333 |
666.18 |
667.500000 |
NaN |
NaN |
NaN |
4695.0 |
4852.0 |
71 |
-0.008828 |
0.000000 |
-0.016111 |
0.306143 |
0.442254 |
31.4 |
5.0 |
79.2 |
35.5 |
4.1 |
-0.735826 |
NaN |
3.364174 |
| 2026-02-01 13:10:00+08:00 |
118 |
790 |
Ws_W68 |
0.519683 |
30 |
790.0 |
790.250000 |
791.18 |
792.583333 |
NaN |
NaN |
NaN |
4808.0 |
4971.0 |
71 |
-0.059201 |
-0.010556 |
-0.063611 |
0.345857 |
0.459155 |
32.6 |
15.0 |
84.2 |
35.5 |
2.9 |
0.037306 |
NaN |
2.937306 |