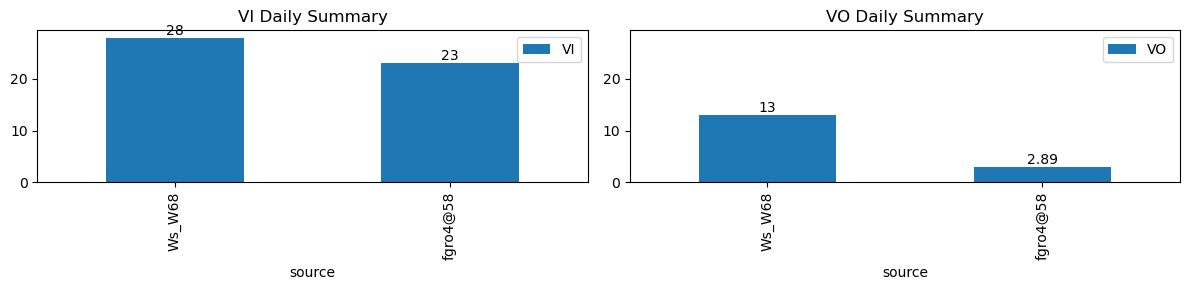
VI and VO Daily Summary
| ws_name | total_dp | nan_dp | nan_filled_dp | long_gap_dp | num_spike |
|---|---|---|---|---|---|
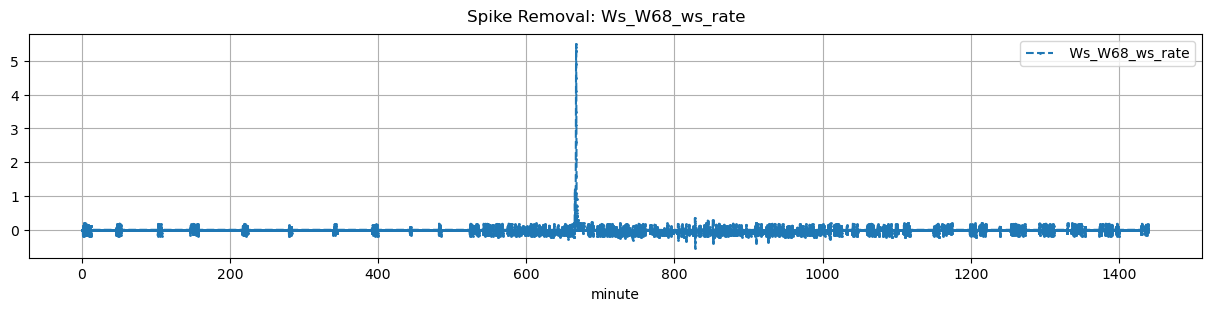
| Ws_W68 | 17280 | 0 | 14568 | 0 | 0 |
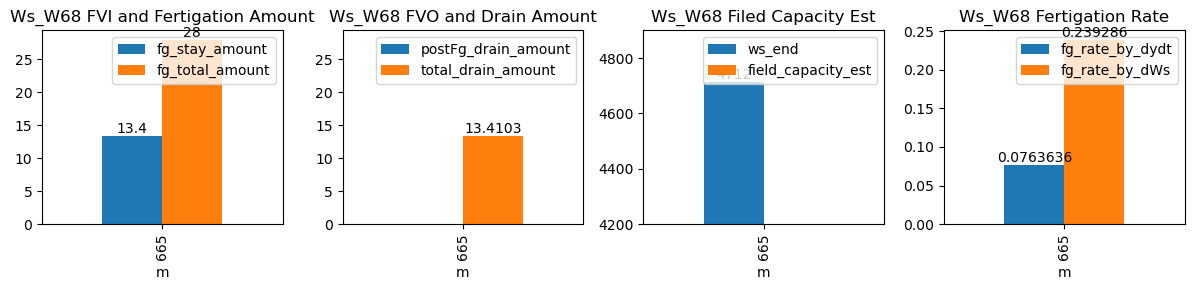
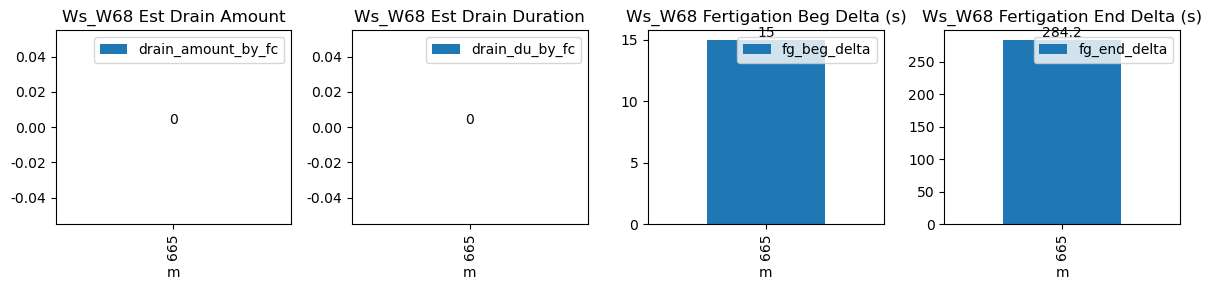
| ds | d | m | ws_name | prominence_cut | max_drain_du | fg_beg | fg_beg_est | fg_end | fg_end_est | drain_amount_by_fc | drain_du_by_fc | drain_rate_by_fc | ws_beg | ws_end | duc | pre_fg_et | post_fg_ws | post_drn_et | fg_rate_by_dydt | fg_rate_by_dWs | fg_stay_amount | fg_beg_delta | fg_end_delta | fg_total_amount | fg_drain_amount | postFg_drain_amount | field_capacity_est | total_drain_amount |
|---|---|---|---|---|---|---|---|---|---|---|---|---|---|---|---|---|---|---|---|---|---|---|---|---|---|---|---|---|
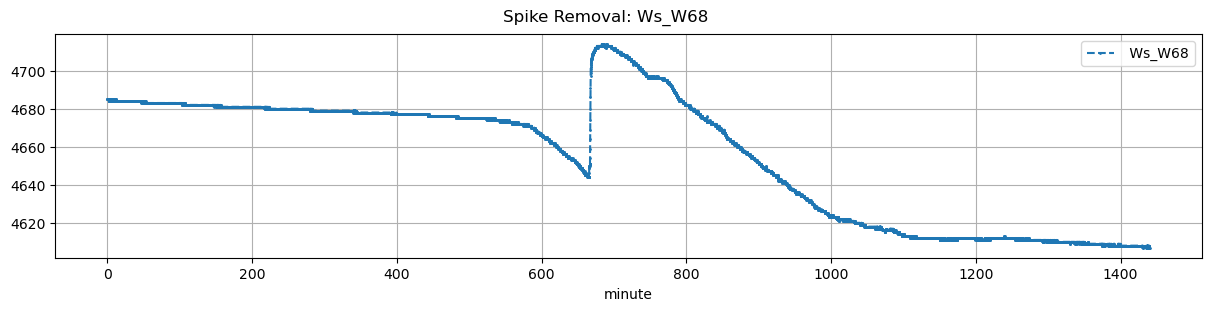
| 2026-01-31 11:05:00+08:00 | 117 | 665 | Ws_W68 | 0.125243 | 30 | 665.0 | 665.25 | 665.93 | 670.666667 | NaN | NaN | NaN | 4645.0 | 4712.0 | 56 | -0.037094 | 0.0 | -0.01875 | 0.076364 | 0.239286 | 13.4 | 15.0 | 284.2 | 28.0 | 14.6 | -1.189747 | NaN | 13.410253 |