| 2026-01-21 11:00:00+08:00 |
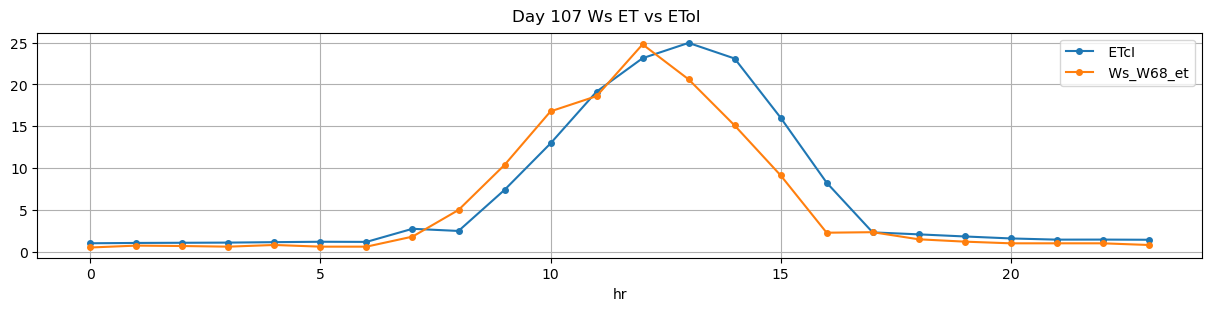
107 |
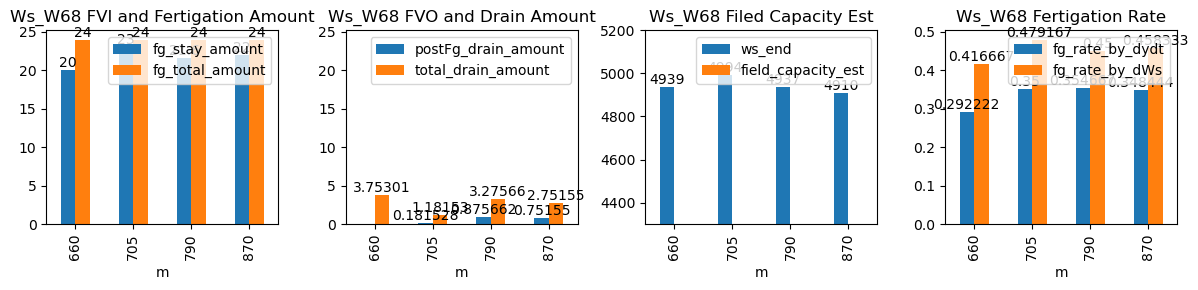
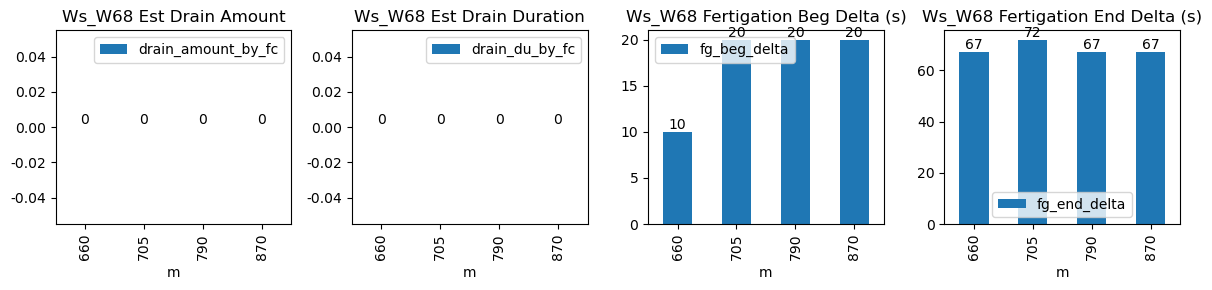
660 |
Ws_W68 |
2.736904 |
30 |
660.0 |
660.166667 |
660.8 |
661.916667 |
NaN |
NaN |
NaN |
4839.0 |
4939.0 |
48 |
-0.128519 |
-0.101944 |
-0.135185 |
0.292222 |
0.416667 |
20.0 |
10.0 |
67.0 |
24.0 |
4.0 |
-0.246992 |
NaN |
3.753008 |
| 2026-01-21 11:45:00+08:00 |
107 |
705 |
Ws_W68 |
2.736904 |
30 |
705.0 |
705.333333 |
705.8 |
707.000000 |
NaN |
NaN |
NaN |
4879.0 |
4994.0 |
48 |
-0.141578 |
-0.147222 |
-0.168771 |
0.350000 |
0.479167 |
23.0 |
20.0 |
72.0 |
24.0 |
1.0 |
0.181528 |
NaN |
1.181528 |
| 2026-01-21 13:10:00+08:00 |
107 |
790 |
Ws_W68 |
2.736904 |
30 |
790.0 |
790.333333 |
790.8 |
791.916667 |
NaN |
NaN |
NaN |
4829.0 |
4937.0 |
48 |
-0.177613 |
-0.133750 |
-0.136435 |
0.354667 |
0.450000 |
21.6 |
20.0 |
67.0 |
24.0 |
2.4 |
0.875662 |
NaN |
3.275662 |
| 2026-01-21 14:30:00+08:00 |
107 |
870 |
Ws_W68 |
2.736904 |
30 |
870.0 |
870.333333 |
870.8 |
871.916667 |
NaN |
NaN |
NaN |
4800.0 |
4910.0 |
48 |
-0.116871 |
-0.067778 |
-0.077806 |
0.348444 |
0.458333 |
22.0 |
20.0 |
67.0 |
24.0 |
2.0 |
0.751550 |
NaN |
2.751550 |