| 2026-01-22 09:50:00+08:00 |
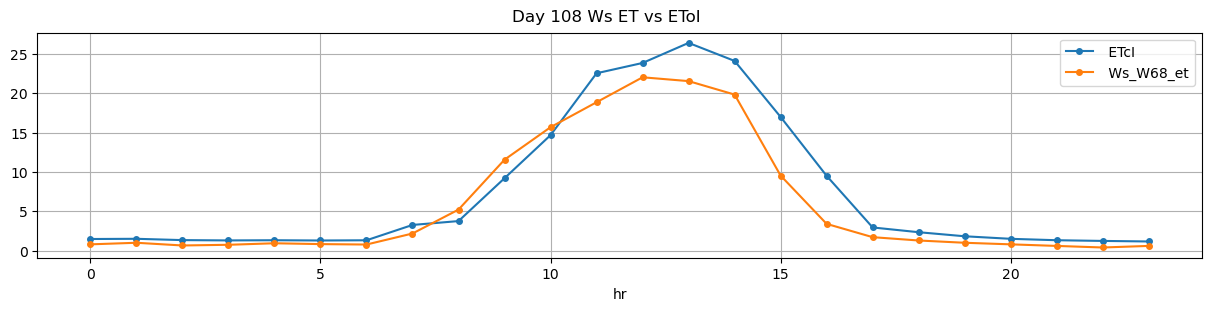
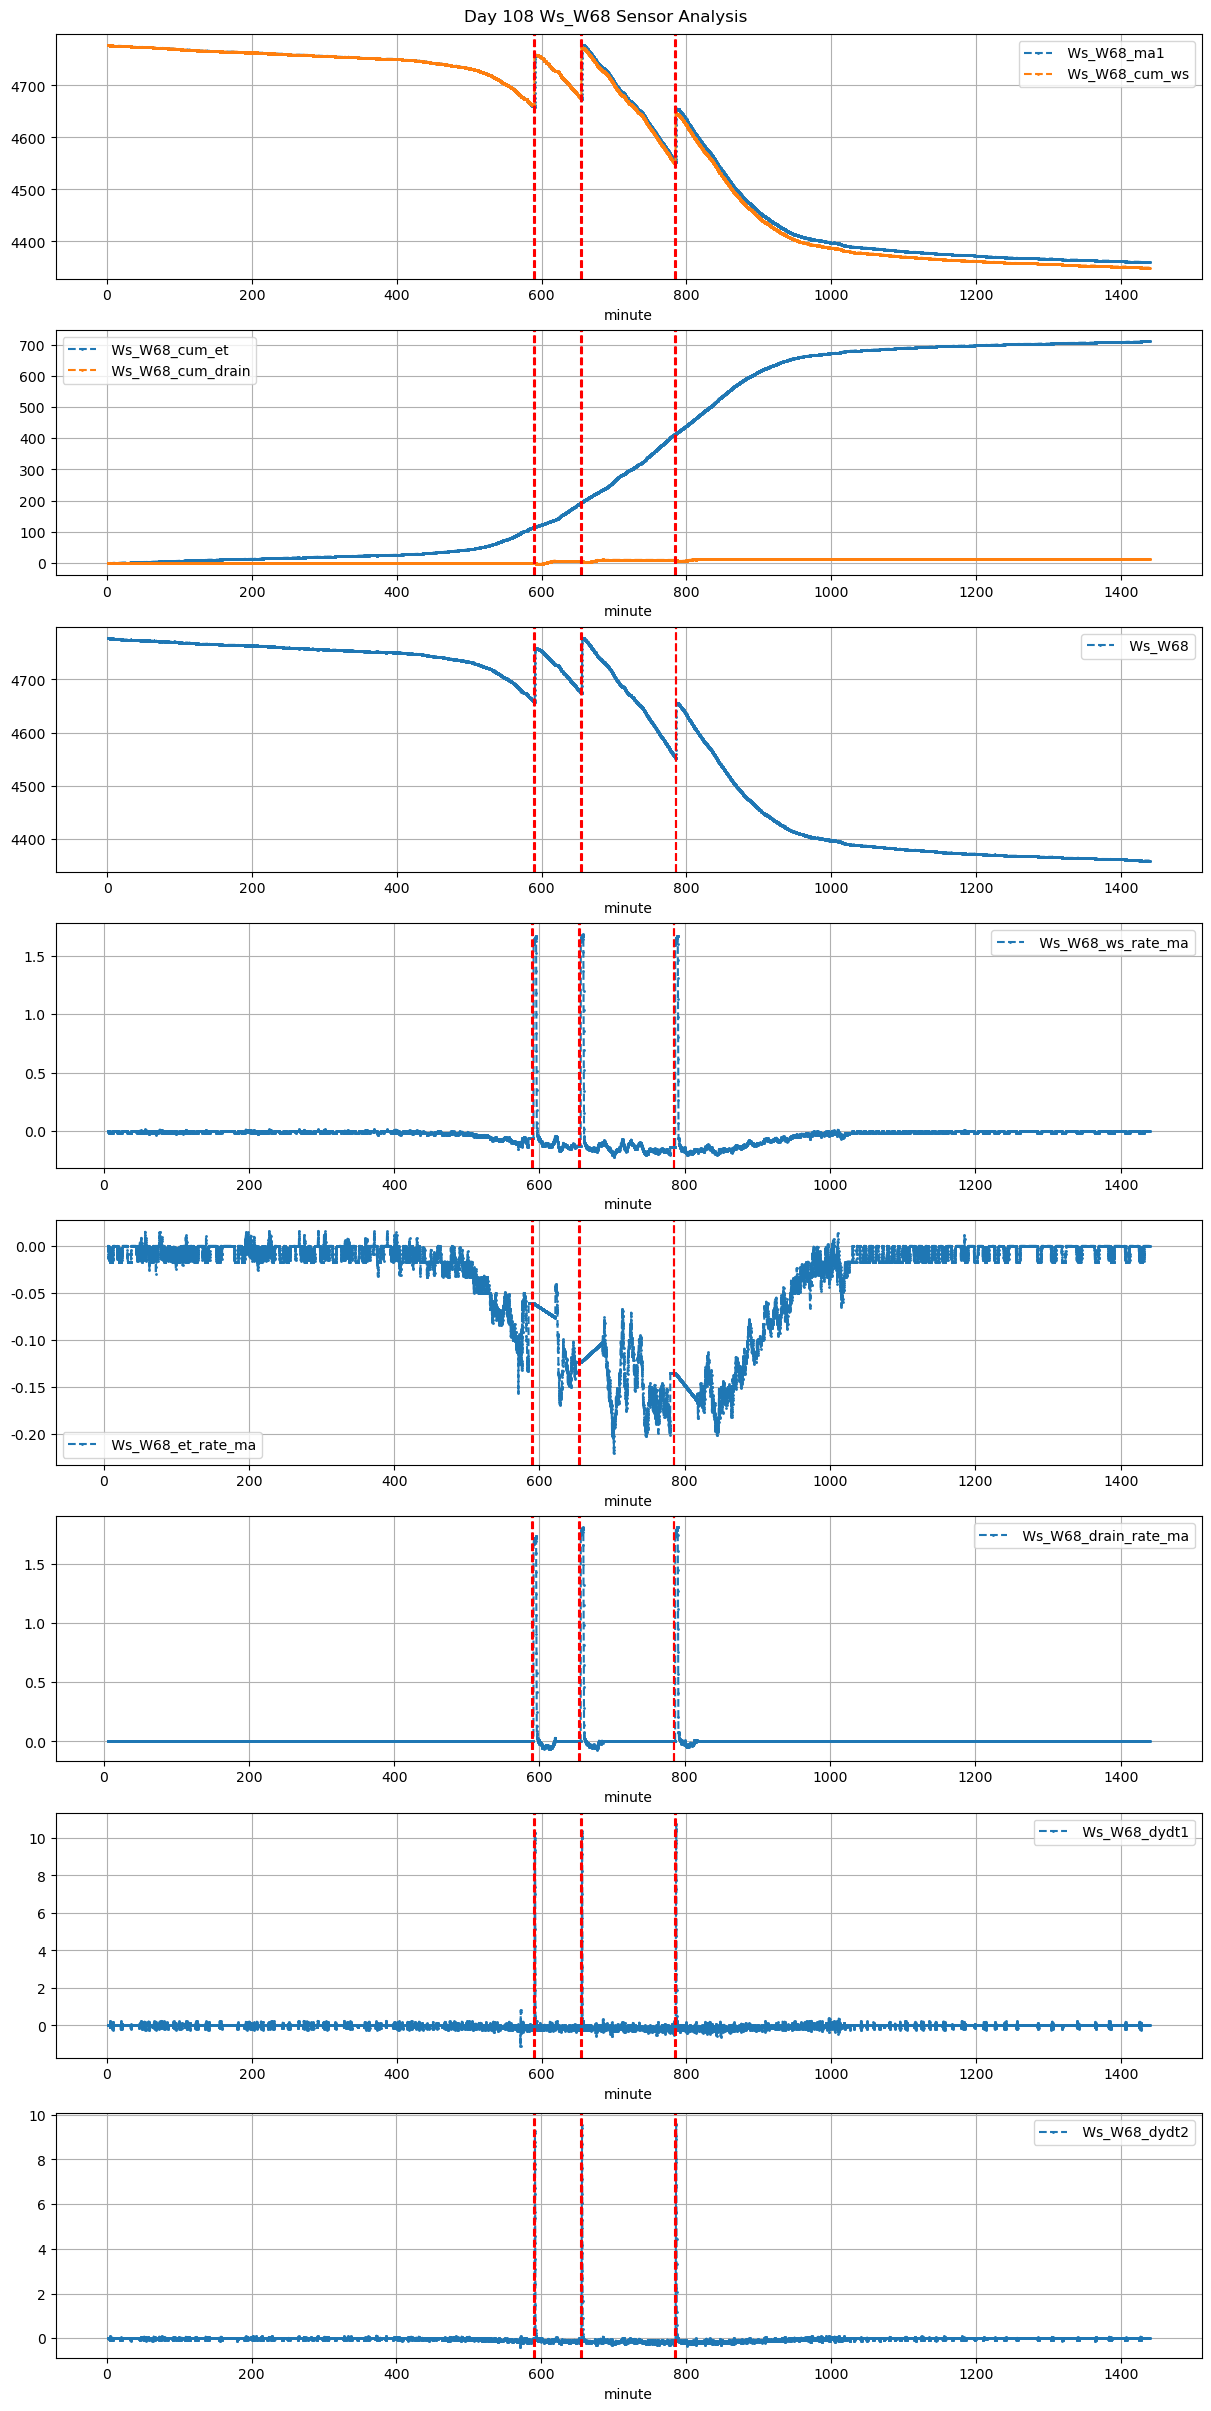
108 |
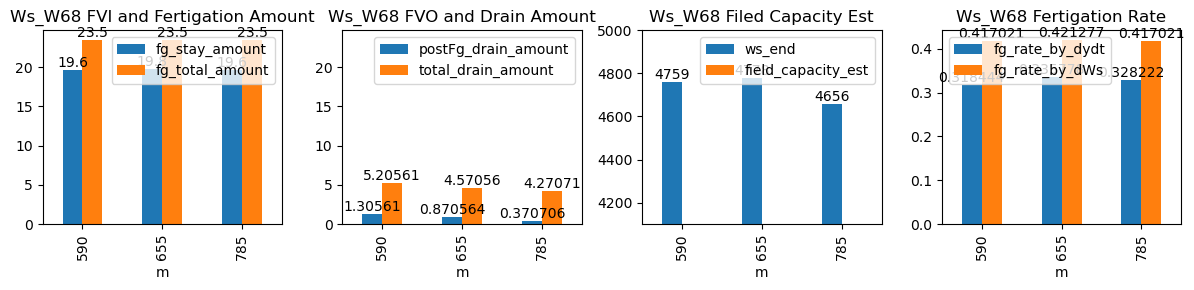
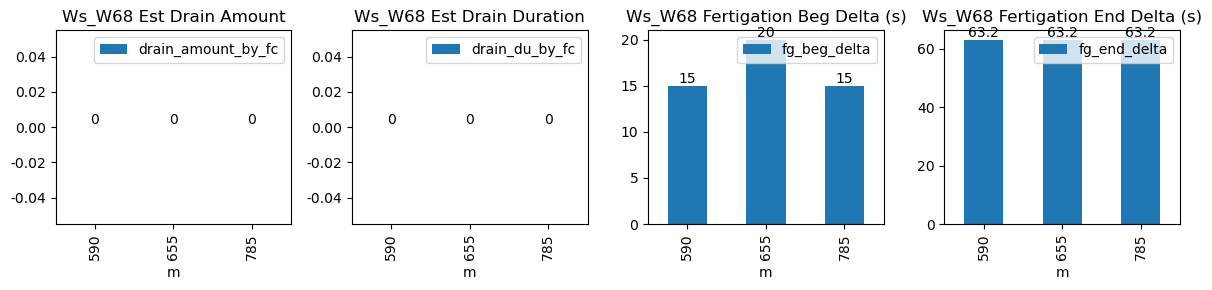
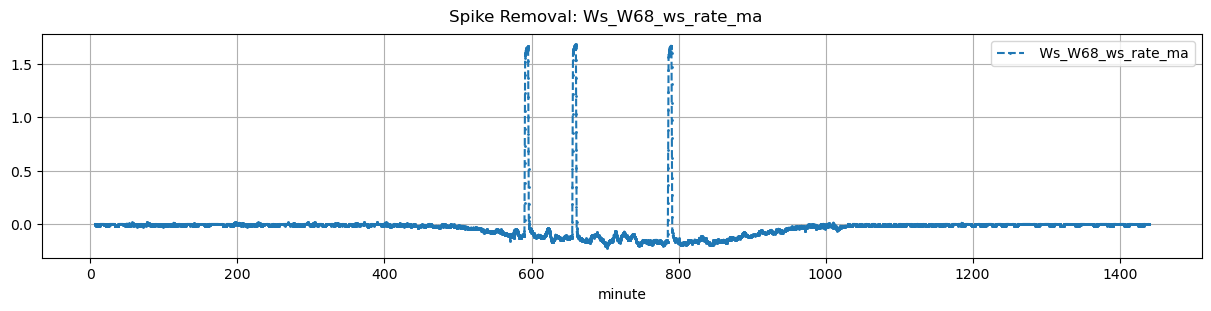
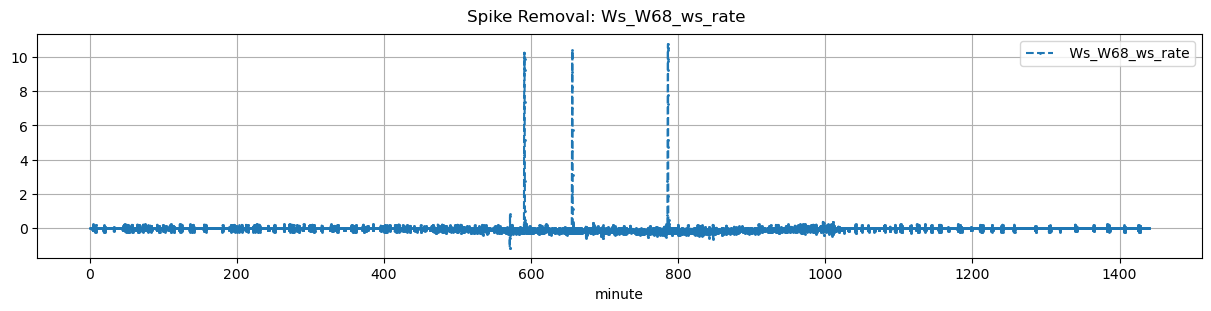
590 |
Ws_W68 |
0.308274 |
30 |
590.0 |
590.250000 |
590.78 |
591.833333 |
NaN |
NaN |
NaN |
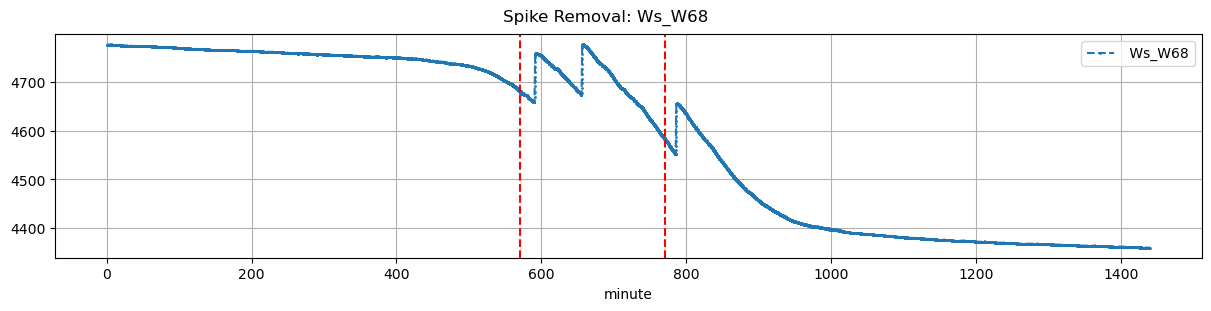
4661.0 |
4759.0 |
47 |
-0.113877 |
-0.060972 |
-0.076149 |
0.318444 |
0.417021 |
19.6 |
15.0 |
63.2 |
23.5 |
3.9 |
1.305609 |
NaN |
5.205609 |
| 2026-01-22 10:55:00+08:00 |
108 |
655 |
Ws_W68 |
0.308274 |
30 |
655.0 |
655.333333 |
655.78 |
656.833333 |
NaN |
NaN |
NaN |
4679.0 |
4778.0 |
47 |
-0.128035 |
-0.123472 |
-0.102373 |
0.335778 |
0.421277 |
19.8 |
20.0 |
63.2 |
23.5 |
3.7 |
0.870564 |
NaN |
4.570564 |
| 2026-01-22 13:05:00+08:00 |
108 |
785 |
Ws_W68 |
0.308274 |
30 |
785.0 |
785.250000 |
785.78 |
786.833333 |
NaN |
NaN |
NaN |
4558.0 |
4656.0 |
47 |
-0.168385 |
-0.135139 |
-0.164444 |
0.328222 |
0.417021 |
19.6 |
15.0 |
63.2 |
23.5 |
3.9 |
0.370706 |
NaN |
4.270706 |