VI and VO Daily Summary
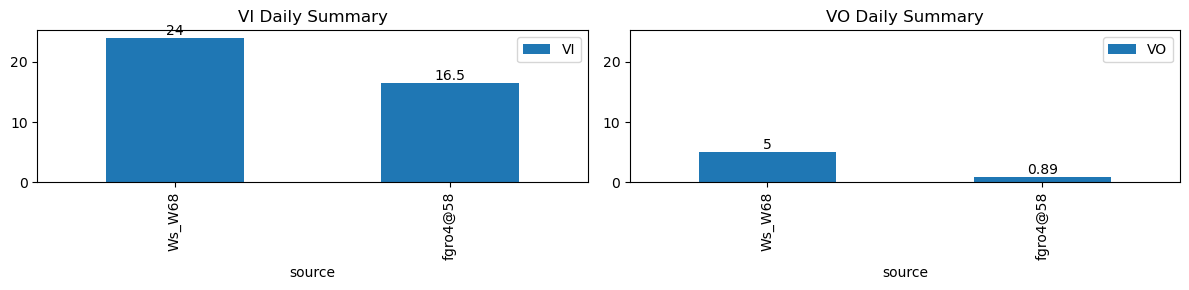
| ws_name | total_dp | nan_dp | nan_filled_dp | long_gap_dp | num_spike |
|---|---|---|---|---|---|
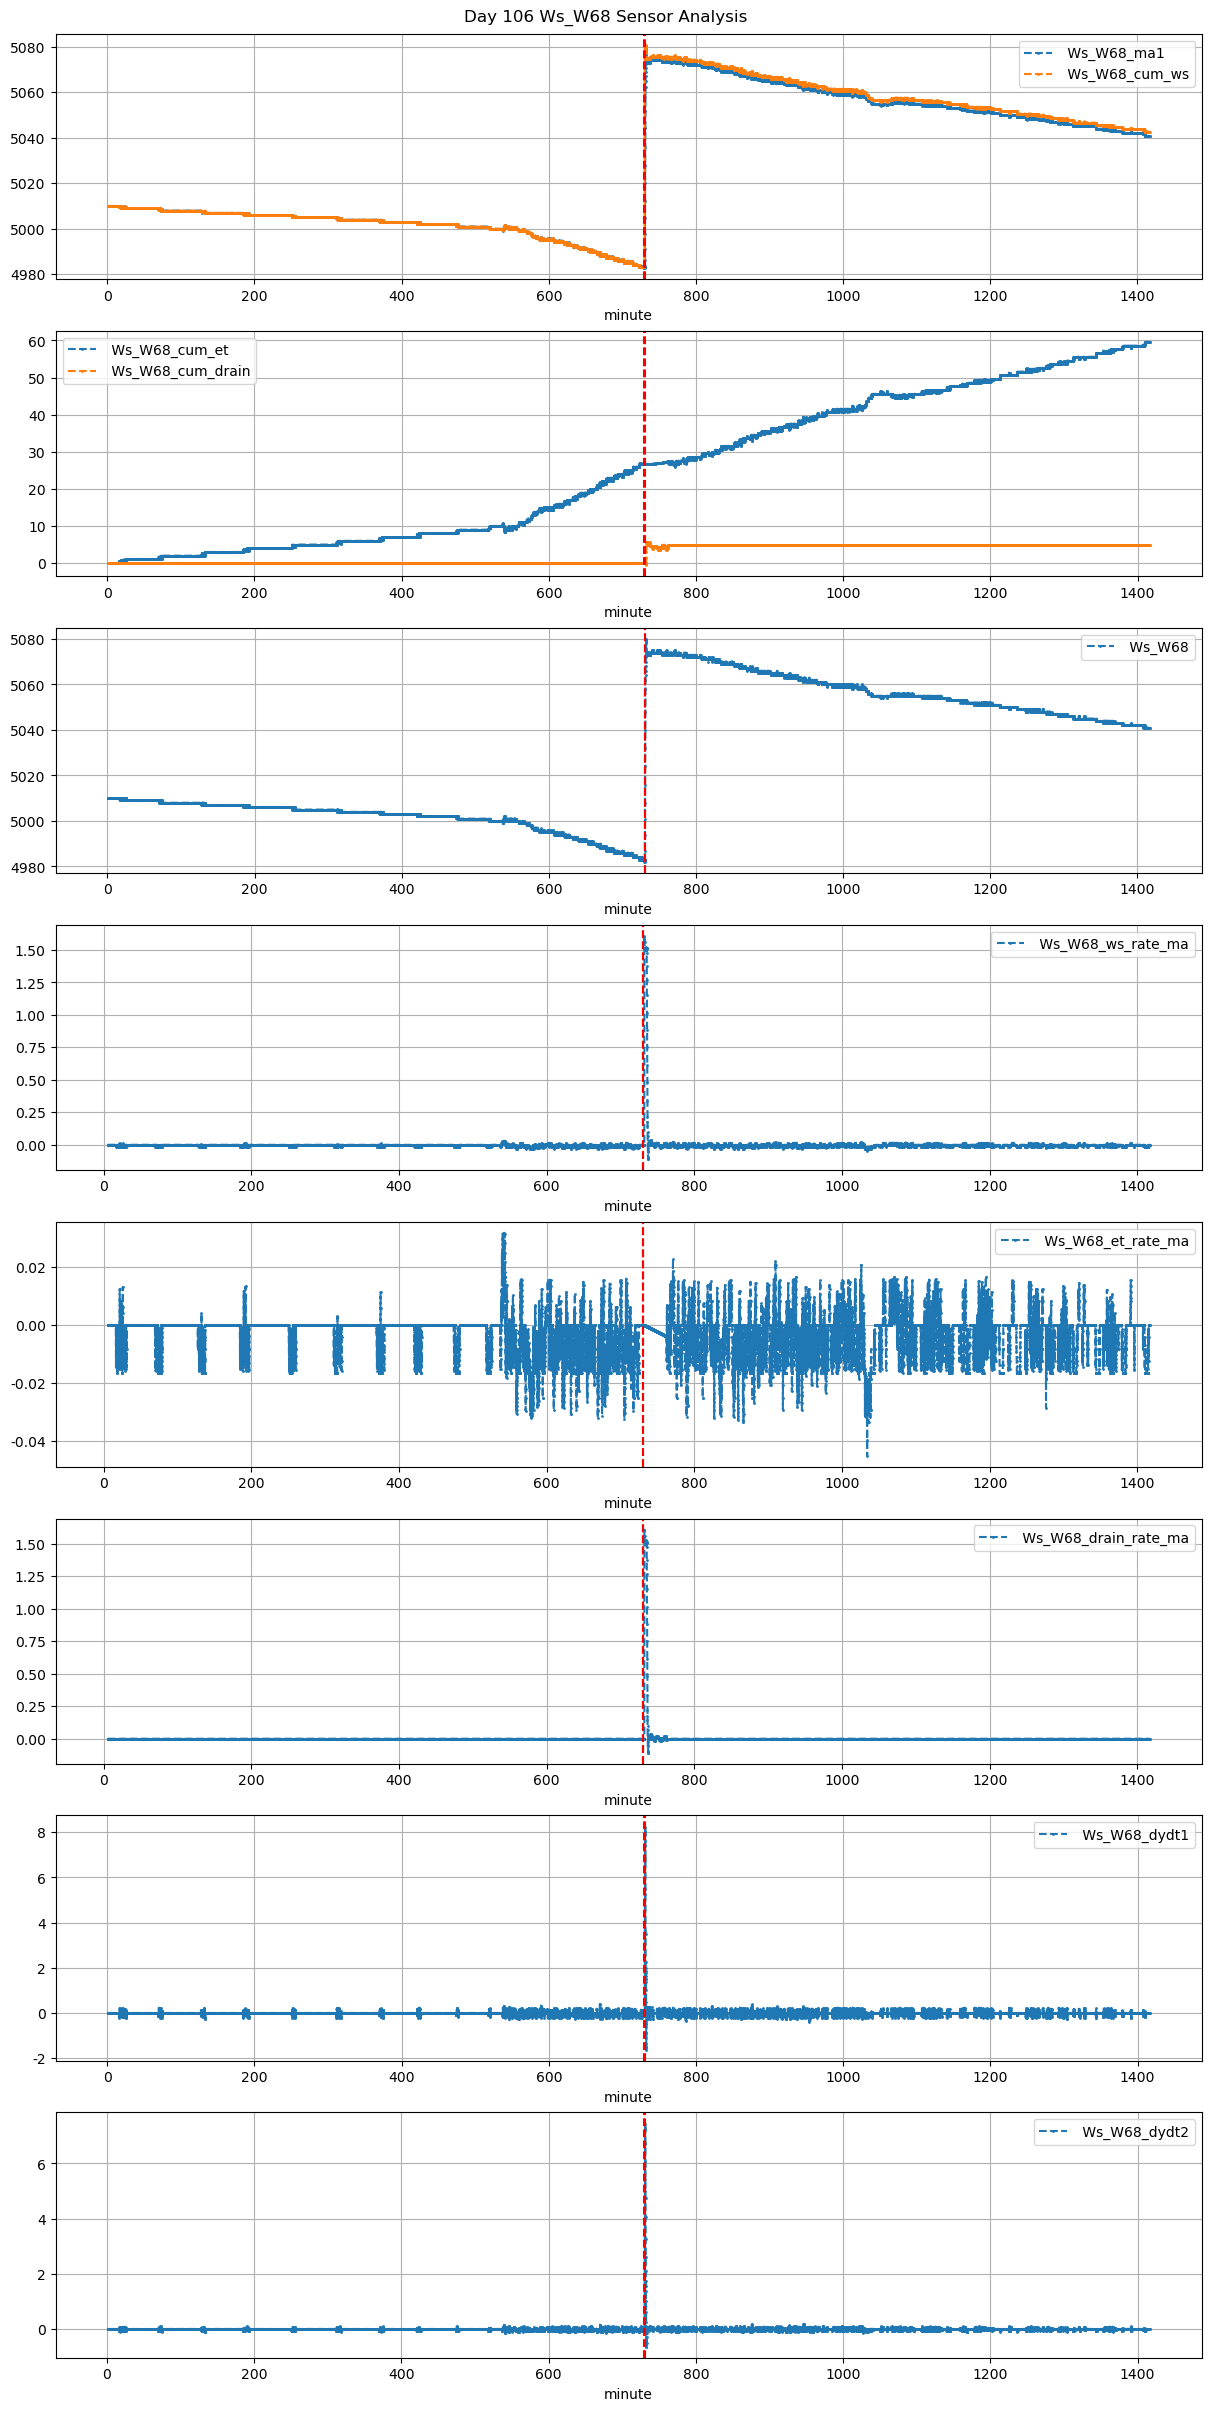
| Ws_W68 | 16995 | 0 | 14045 | 0 | 0 |
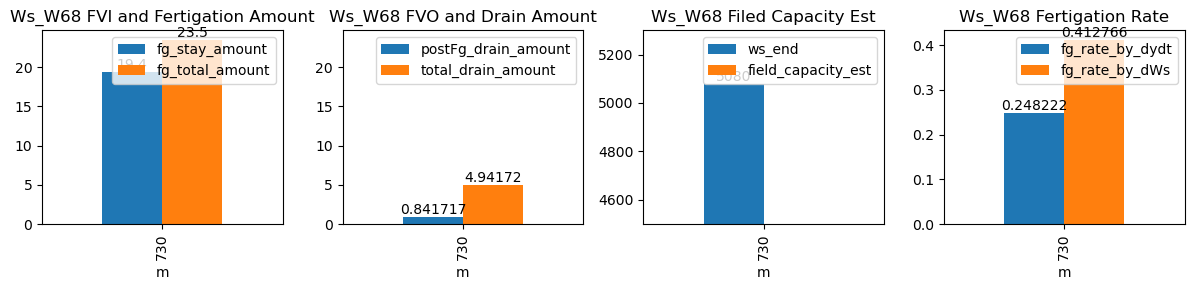
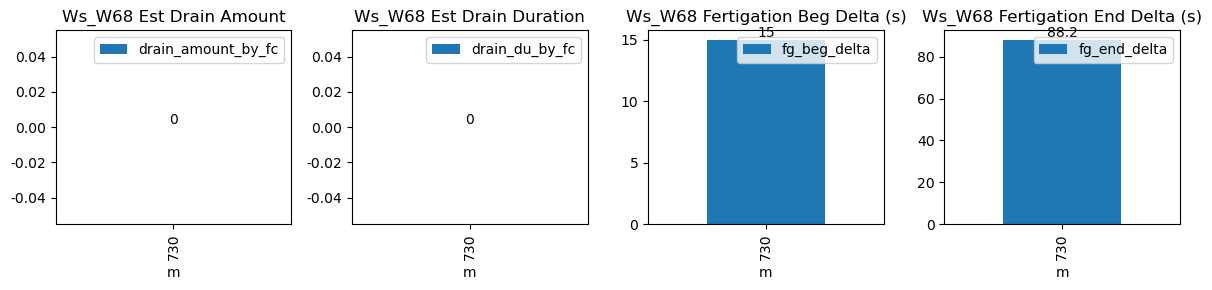
| ds | d | m | ws_name | prominence_cut | max_drain_du | fg_beg | fg_beg_est | fg_end | fg_end_est | drain_amount_by_fc | drain_du_by_fc | drain_rate_by_fc | ws_beg | ws_end | duc | pre_fg_et | post_fg_ws | post_drn_et | fg_rate_by_dydt | fg_rate_by_dWs | fg_stay_amount | fg_beg_delta | fg_end_delta | fg_total_amount | fg_drain_amount | postFg_drain_amount | field_capacity_est | total_drain_amount |
|---|---|---|---|---|---|---|---|---|---|---|---|---|---|---|---|---|---|---|---|---|---|---|---|---|---|---|---|---|
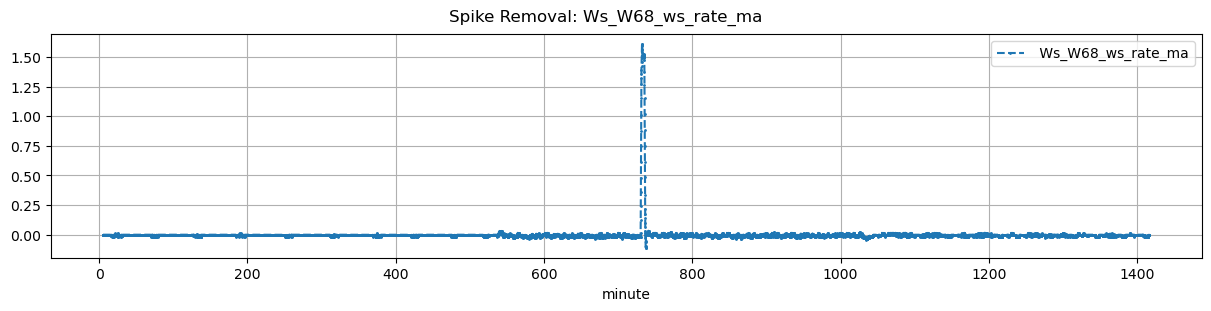
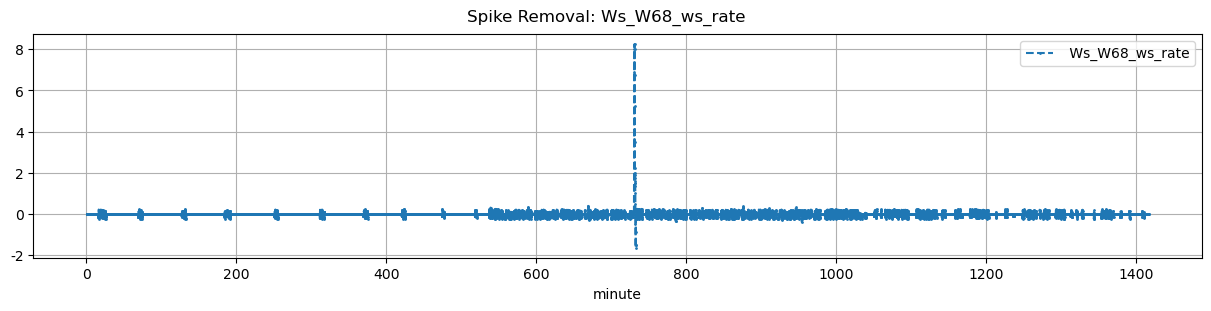
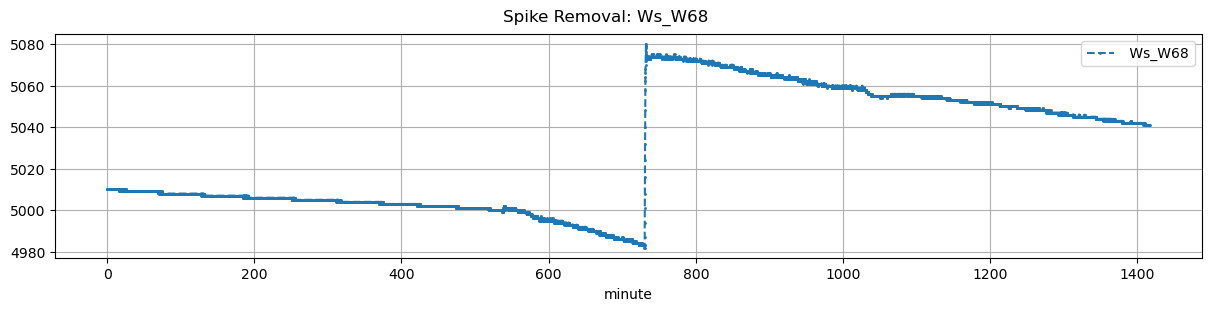
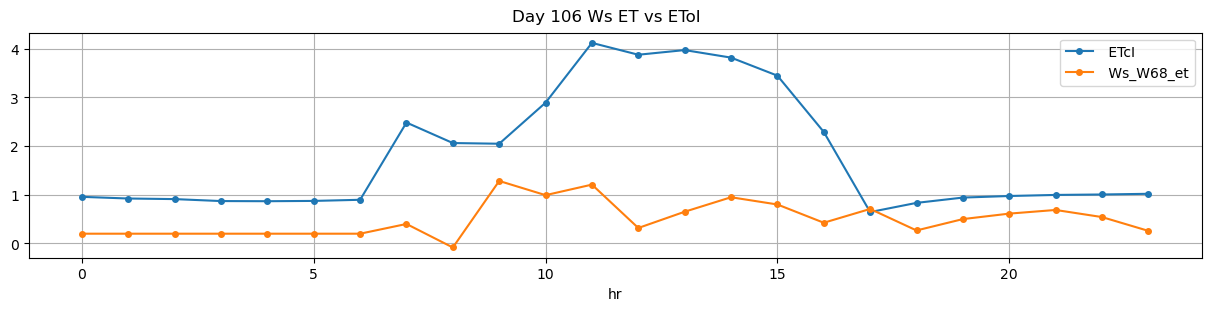
| 2026-01-20 12:10:00+08:00 | 106 | 730 | Ws_W68 | 0.132692 | 30 | 730.0 | 730.25 | 730.78 | 732.25 | NaN | NaN | NaN | 4983.0 | 5080.0 | 47 | -0.007284 | 0.0 | -0.003902 | 0.248222 | 0.412766 | 19.4 | 15.0 | 88.2 | 23.5 | 4.1 | 0.841717 | NaN | 4.941717 |