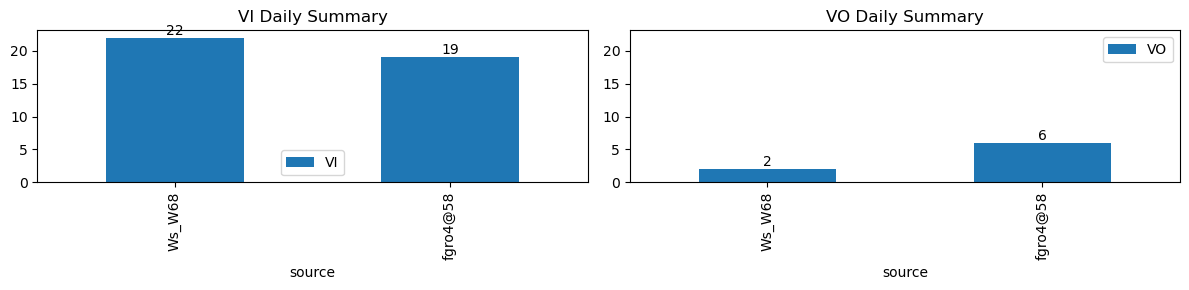
VI and VO Daily Summary
| ws_name | total_dp | nan_dp | nan_filled_dp | long_gap_dp | num_spike |
|---|---|---|---|---|---|
| Ws_W68 | 17263 | 0 | 14781 | 0 | 0 |
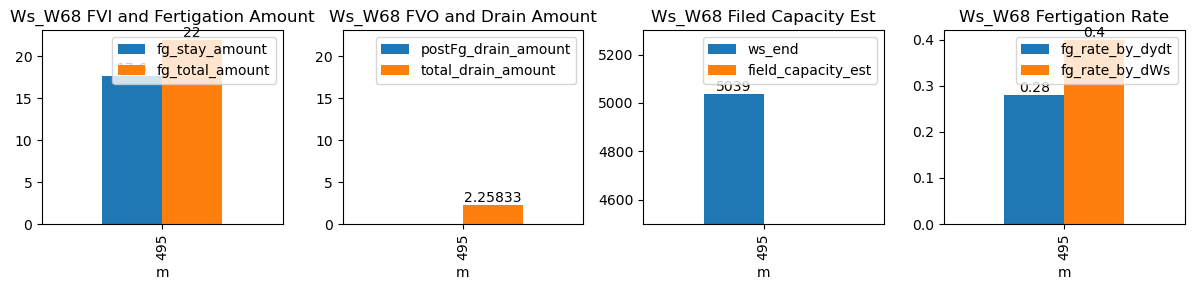
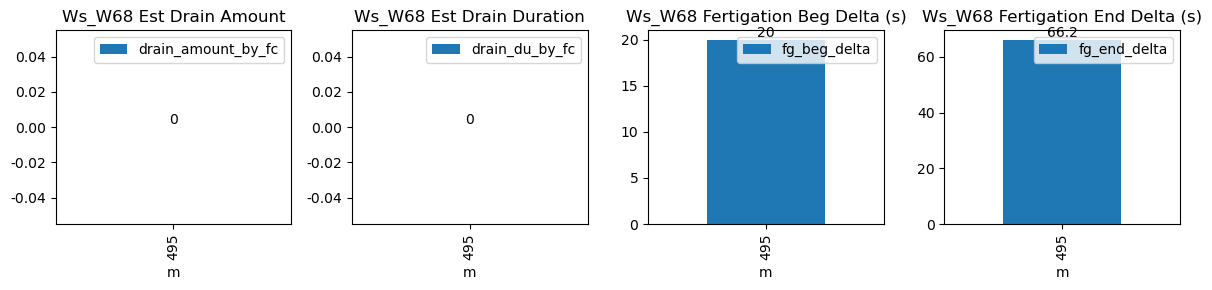
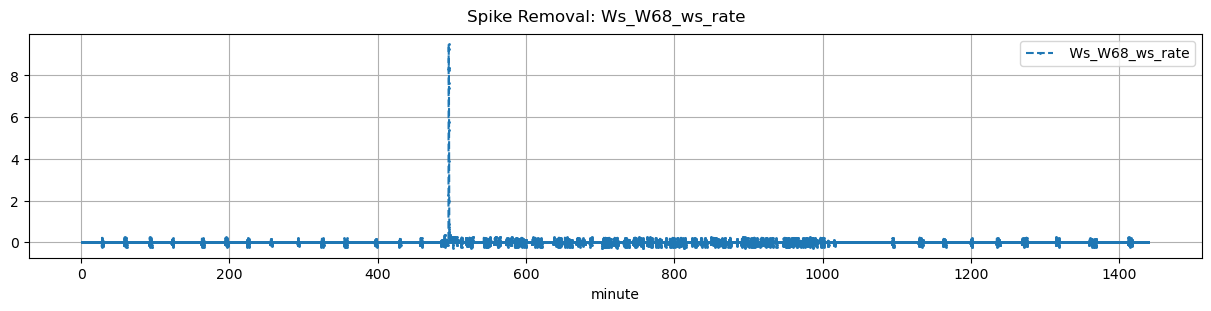
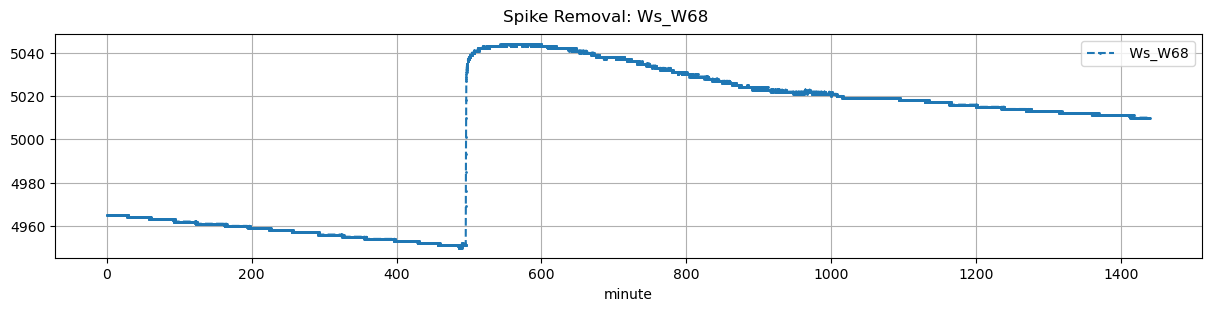
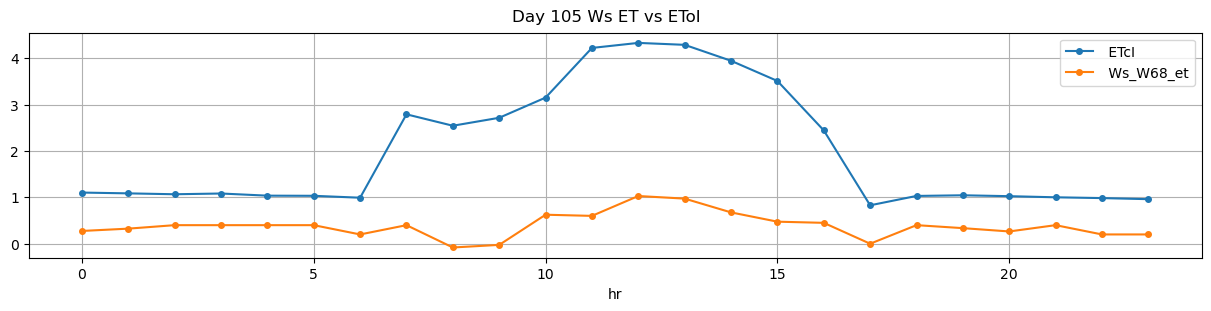
| ds | d | m | ws_name | prominence_cut | max_drain_du | fg_beg | fg_beg_est | fg_end | fg_end_est | drain_amount_by_fc | drain_du_by_fc | drain_rate_by_fc | ws_beg | ws_end | duc | pre_fg_et | post_fg_ws | post_drn_et | fg_rate_by_dydt | fg_rate_by_dWs | fg_stay_amount | fg_beg_delta | fg_end_delta | fg_total_amount | fg_drain_amount | postFg_drain_amount | field_capacity_est | total_drain_amount |
|---|---|---|---|---|---|---|---|---|---|---|---|---|---|---|---|---|---|---|---|---|---|---|---|---|---|---|---|---|
| 2026-01-19 08:15:00+08:00 | 105 | 495 | Ws_W68 | 0.107991 | 30 | 495.0 | 495.333333 | 495.73 | 496.833333 | NaN | NaN | NaN | 4951.0 | 5039.0 | 44 | 0.0 | 0.0 | 0.0 | 0.28 | 0.4 | 17.6 | 20.0 | 66.2 | 22.0 | 4.4 | -2.141667 | NaN | 2.258333 |