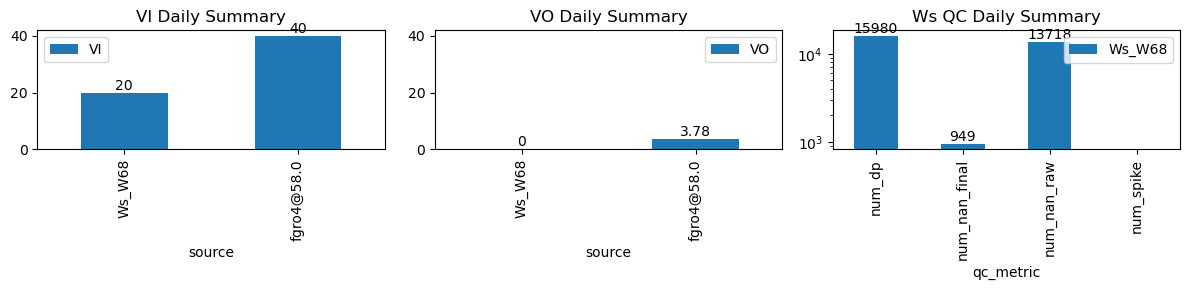
VI and VO Daily Summary
| ws_name | num_dp | num_nan_raw | num_nan_final | num_spike | cum_step_adj |
|---|---|---|---|---|---|
| Ws_W68 | 15,980 | 13,718 | 949 | 0 | 0.00 |
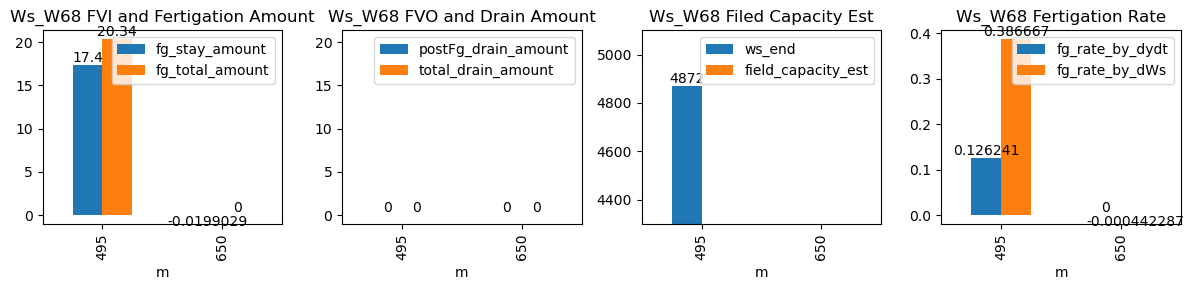
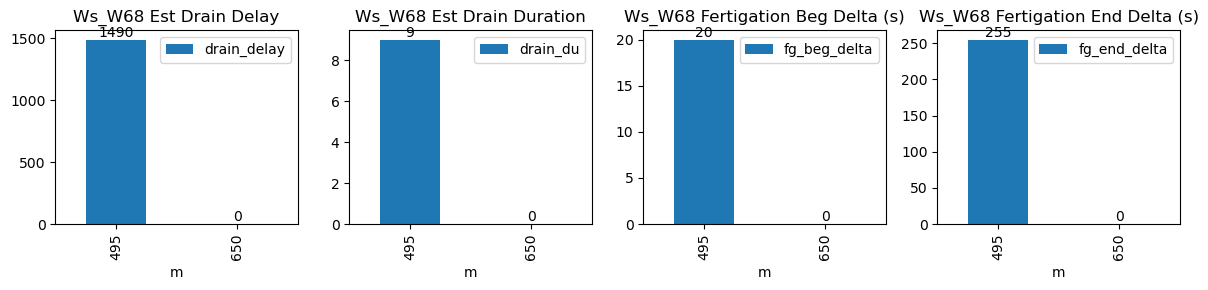
| ds | d | m | ws_name | prominence_cut | max_drain_du | fg_beg | fg_beg_est | fg_end | fg_end_est | ws_beg | ws_end | duc | pre_fg_et | post_fg_ws | post_drn_et | fg_rate_by_dydt | fg_rate_by_dWs | fg_stay_amount | enough_data | fg_beg_delta | fg_end_delta | fg_total_amount | fg_drain_amount | postFg_drain_amount | total_drain_amount | drain_du | drain_delay | drain_rate | field_capacity_est |
|---|---|---|---|---|---|---|---|---|---|---|---|---|---|---|---|---|---|---|---|---|---|---|---|---|---|---|---|---|---|
| 2026-02-06 08:15:00+08:00 | 123 | 495 | Ws_W68 | 0.105489 | 30 | 495.0 | 495.333333 | 495.75 | 500.0 | 4785.0 | 4872.0 | 45 | 0.000000 | 0.0 | 0.000000 | 0.126241 | 0.386667 | 17.400000 | True | 20.0 | 255.0 | 20.34 | 0.0 | 0.0 | 0.0 | 9.0 | 1490.0 | -0.009306 | NaN |
| 2026-02-06 10:50:00+08:00 | 123 | 650 | Ws_W68 | 0.105489 | 30 | 650.0 | NaN | 650.75 | NaN | NaN | NaN | 45 | -0.019903 | NaN | -0.019903 | NaN | -0.000442 | -0.019903 | False | NaN | NaN | NaN | NaN | NaN | NaN | NaN | NaN | NaN | NaN |