| 2026-02-05 08:15:00+08:00 |
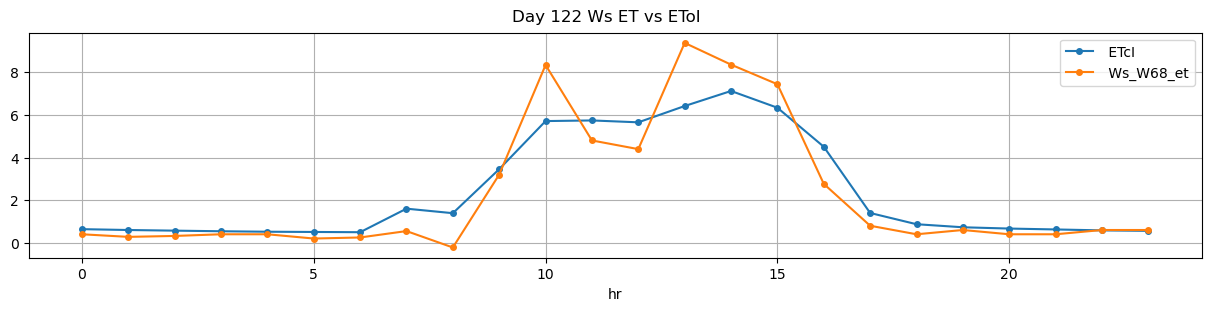
122 |
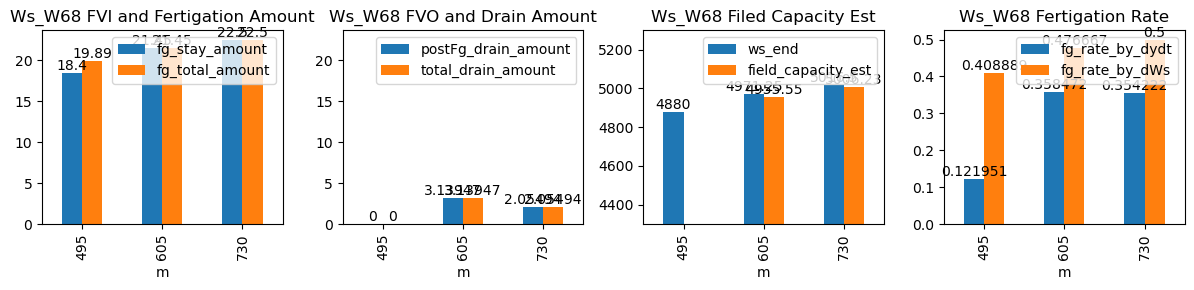
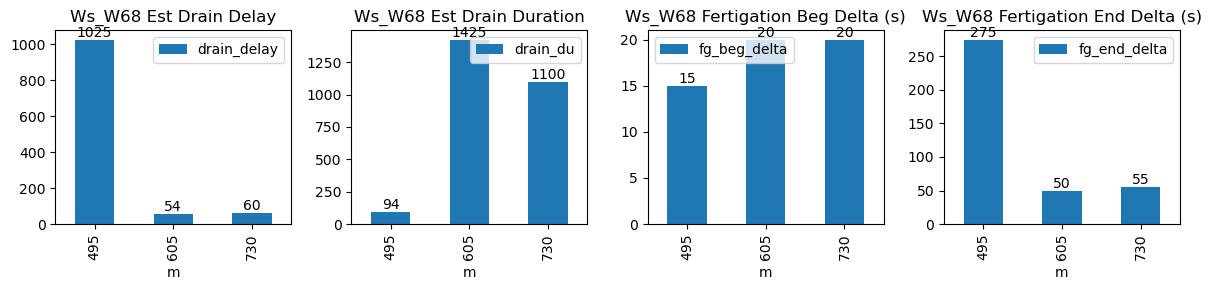
495 |
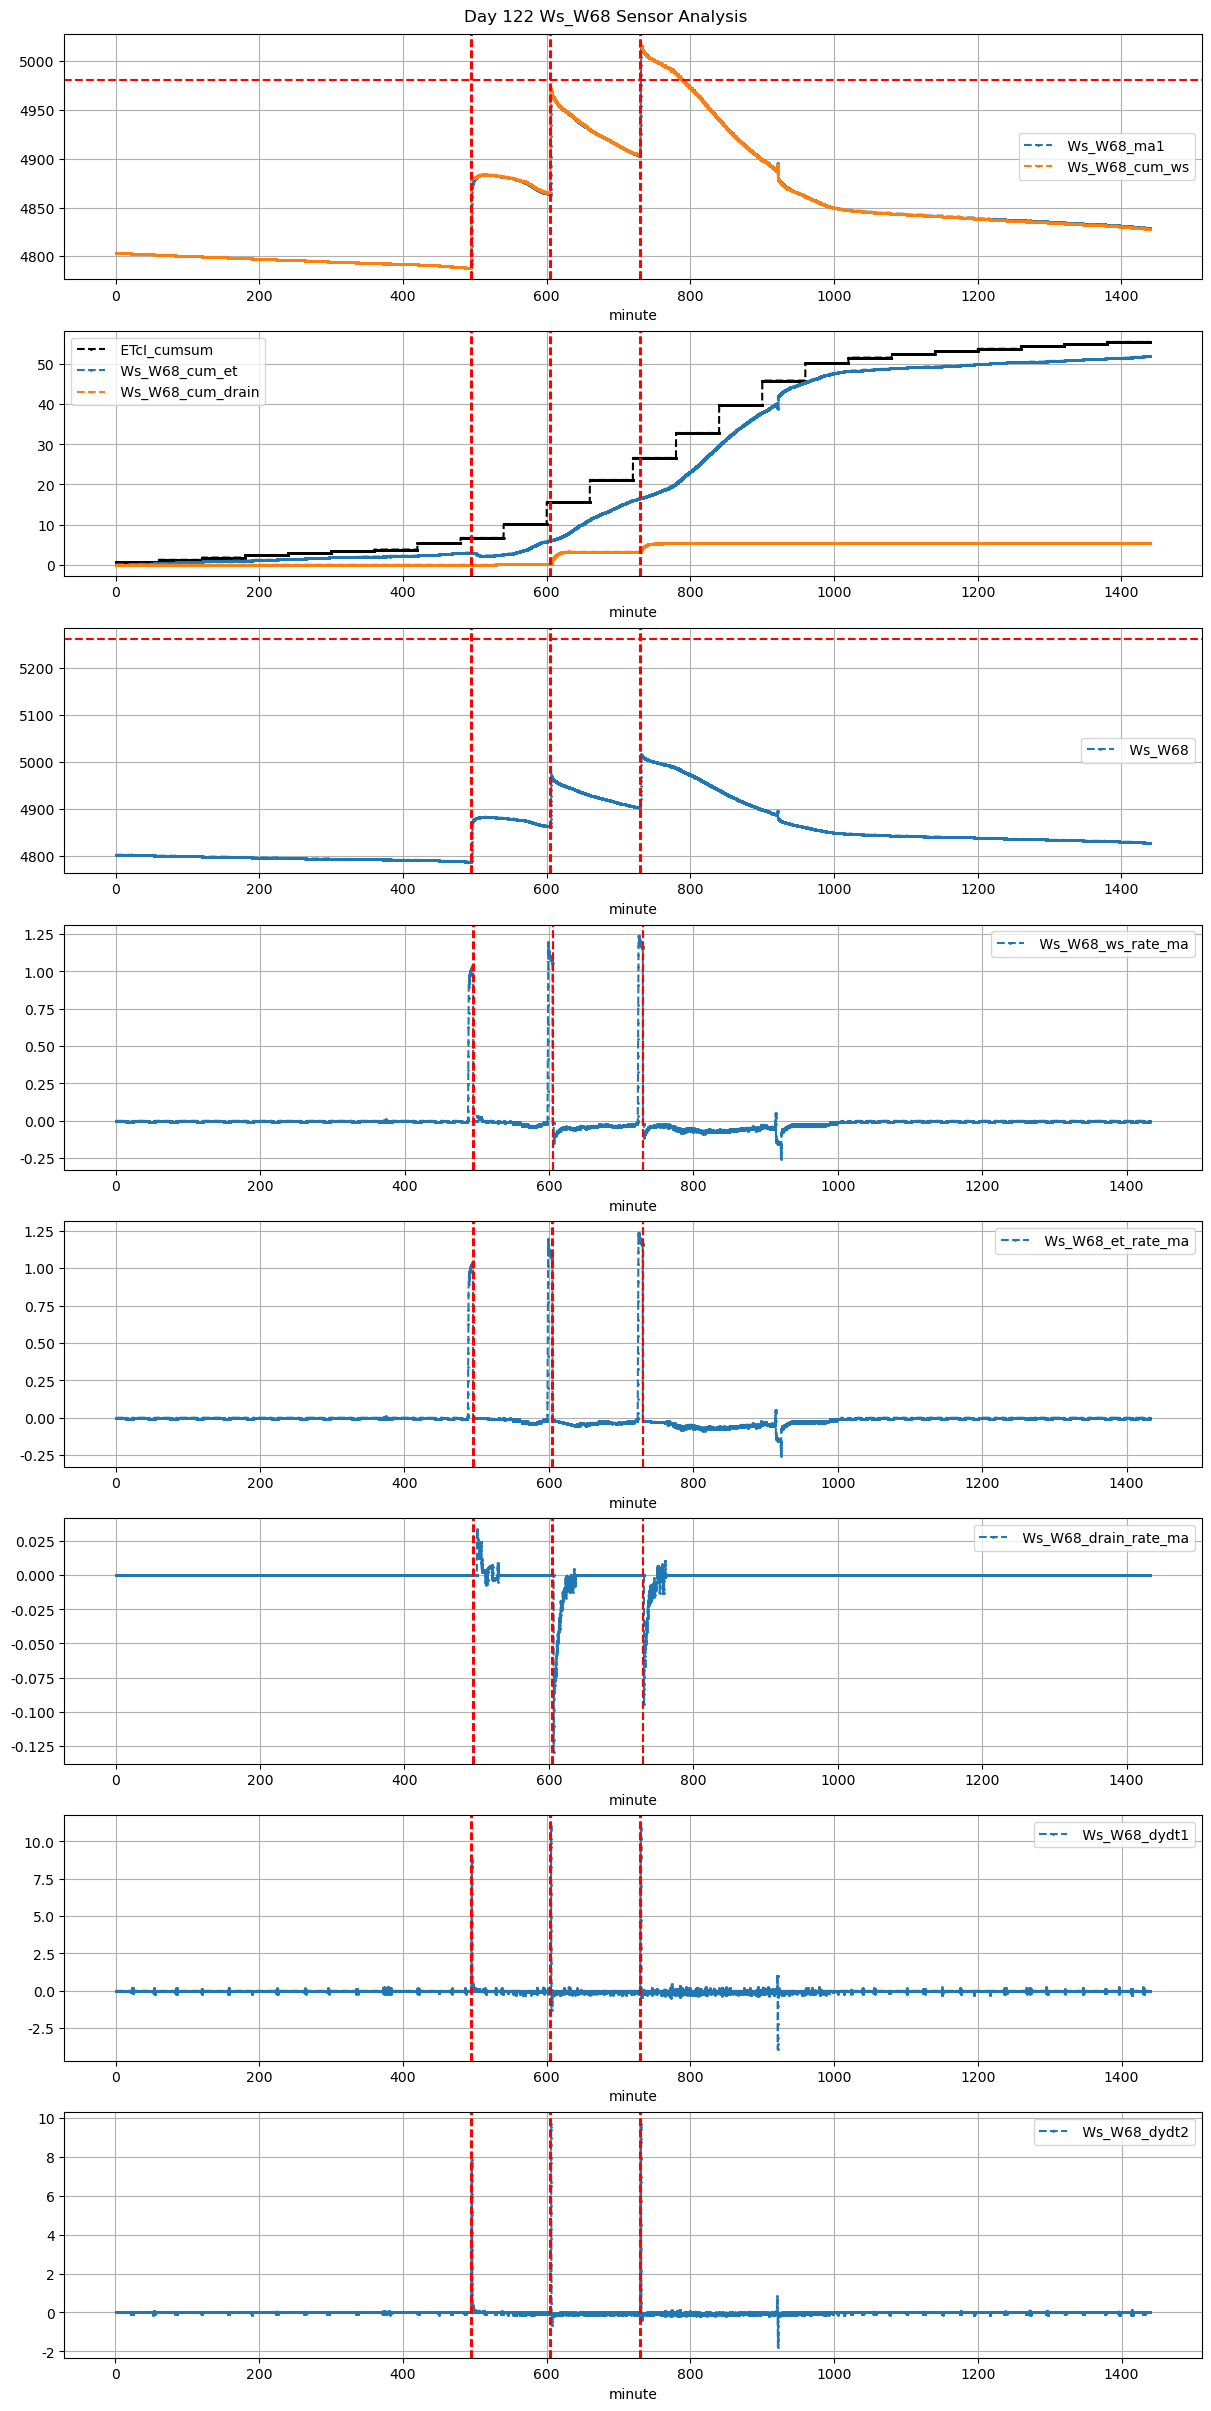
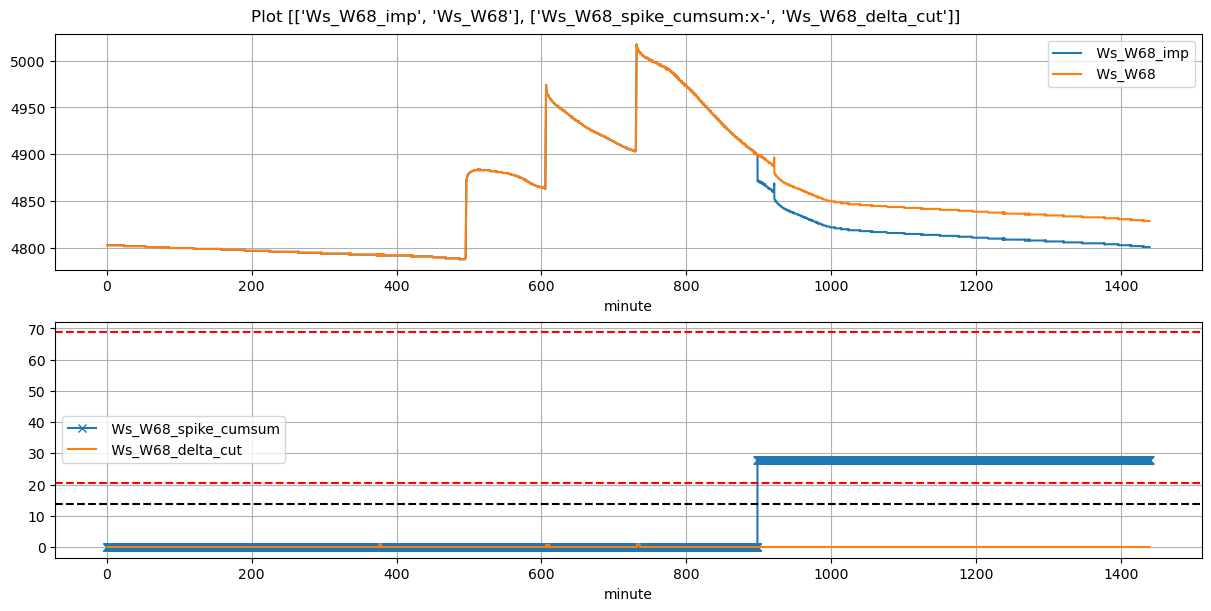
Ws_W68 |
0.338509 |
30 |
495.0 |
495.250000 |
495.75 |
500.166667 |
4788.0 |
4880.0 |
45 |
-0.004159 |
0.000000 |
-0.013333 |
0.129086 |
0.408889 |
18.4 |
True |
15.0 |
265.0 |
19.89 |
0.0 |
0.000000 |
0.000000 |
15 |
1179 |
-0.180687 |
NaN |
| 2026-02-05 10:05:00+08:00 |
122 |
605 |
Ws_W68 |
0.338509 |
30 |
605.0 |
605.333333 |
605.75 |
606.500000 |
4864.0 |
4974.0 |
45 |
-0.015241 |
-0.103750 |
-0.054444 |
0.361889 |
0.488889 |
22.0 |
True |
20.0 |
45.0 |
22.00 |
0.0 |
0.000000 |
0.000000 |
45 |
54 |
-0.242848 |
NaN |
| 2026-02-05 12:10:00+08:00 |
122 |
730 |
Ws_W68 |
0.338509 |
30 |
730.0 |
730.333333 |
730.75 |
731.500000 |
4903.5 |
5017.0 |
45 |
-0.022681 |
-0.085194 |
-0.035278 |
0.359556 |
0.504444 |
22.7 |
True |
20.0 |
45.0 |
22.70 |
0.0 |
1.556258 |
1.556258 |
105 |
60 |
-0.224635 |
NaN |