| 2026-02-09 08:25:00+08:00 |
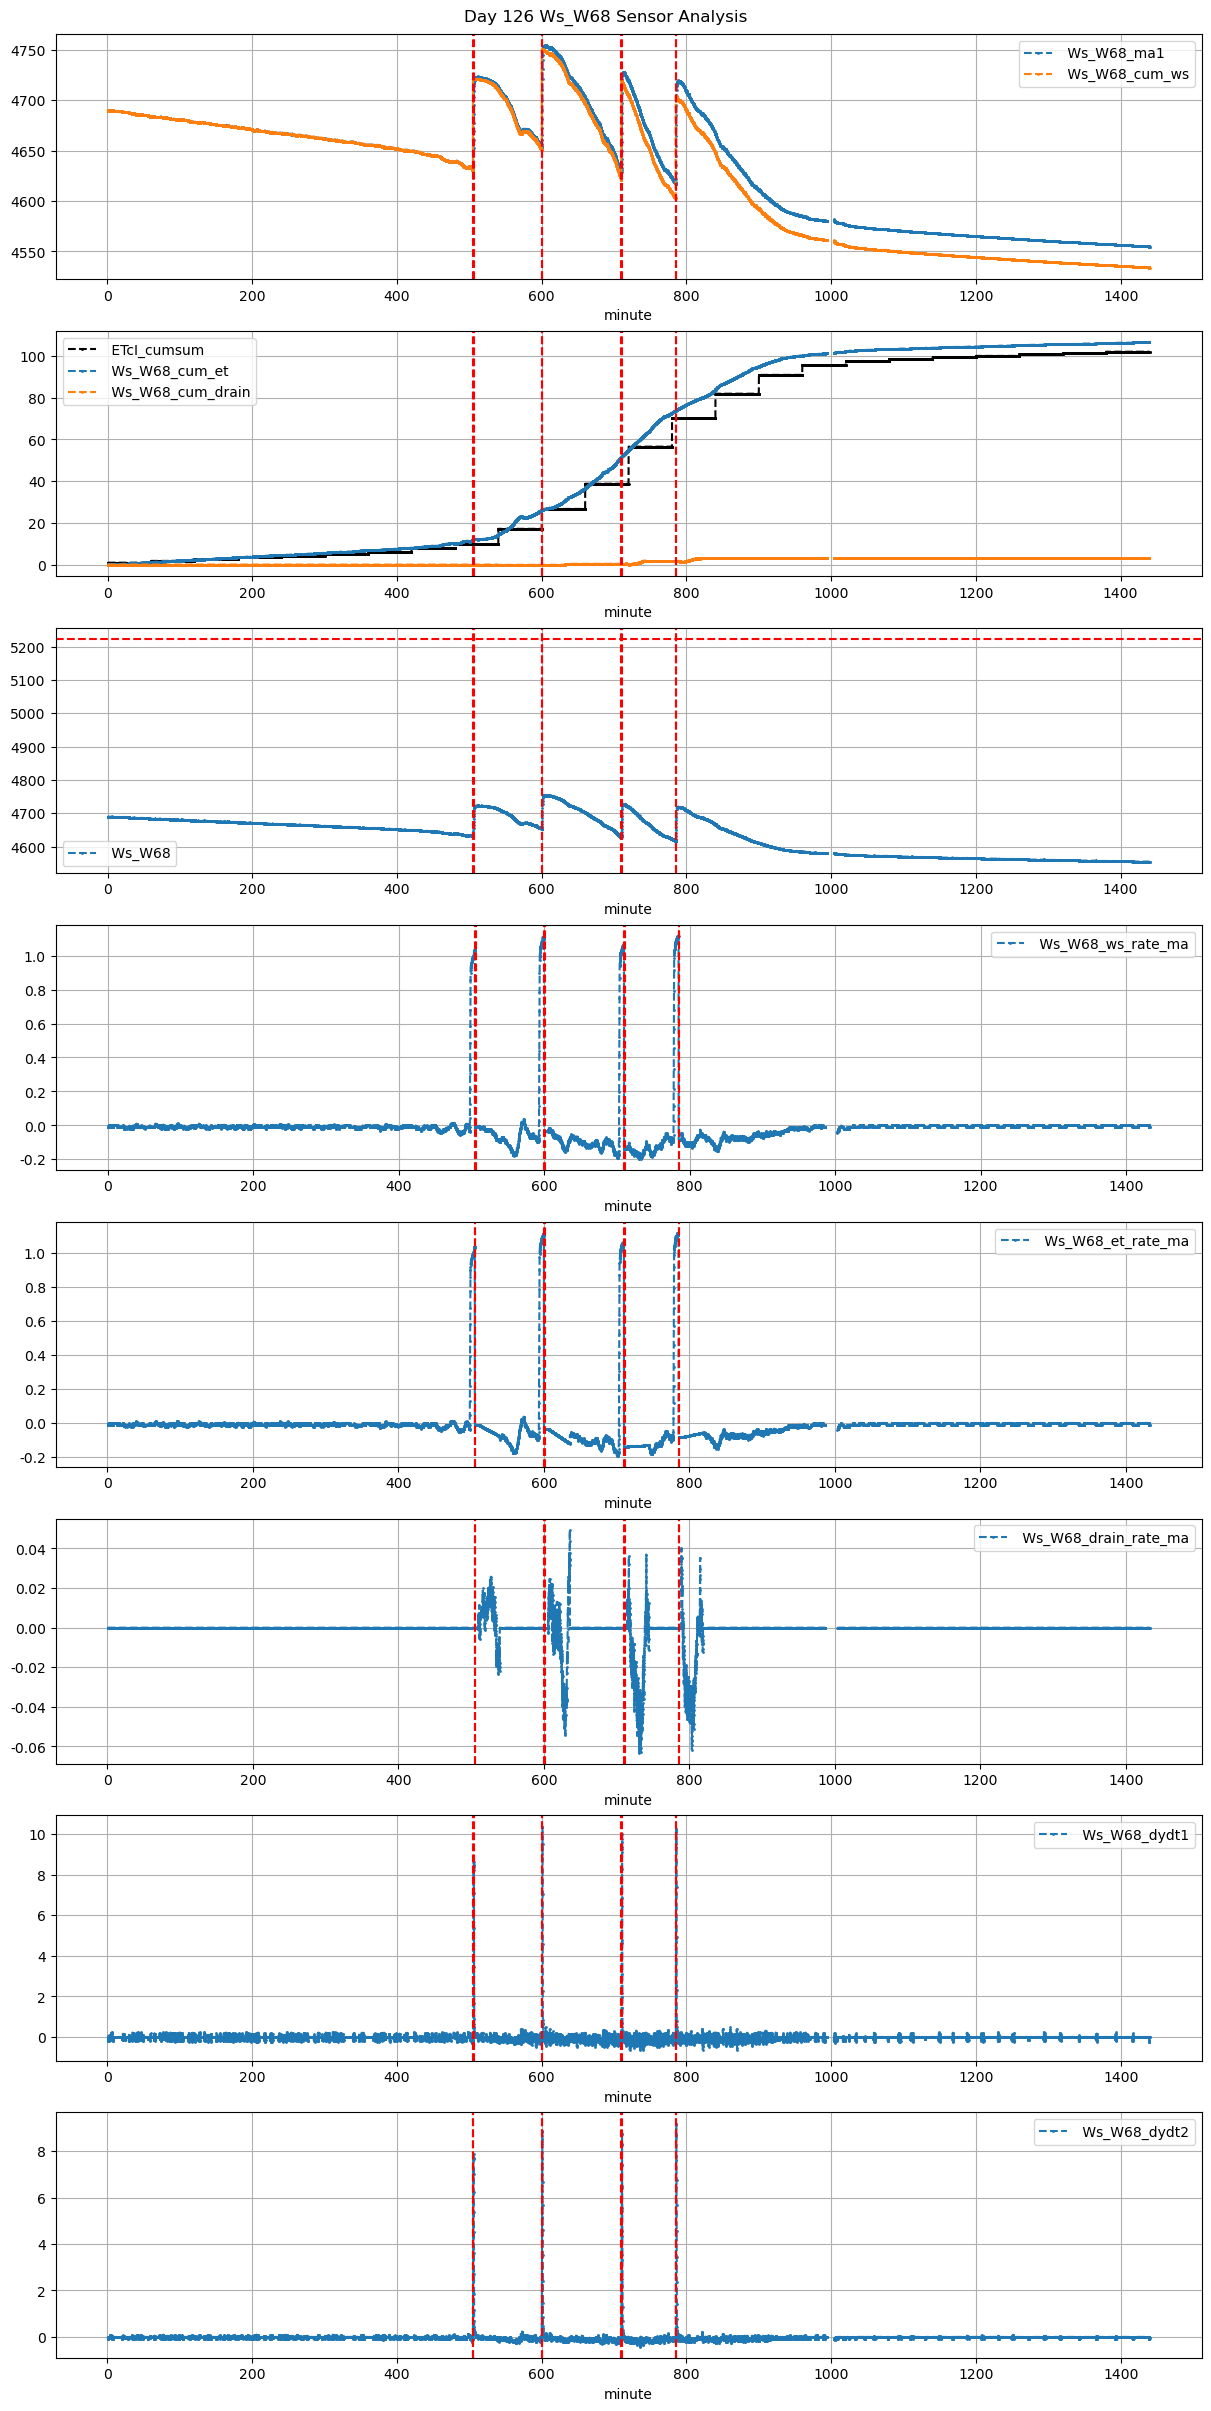
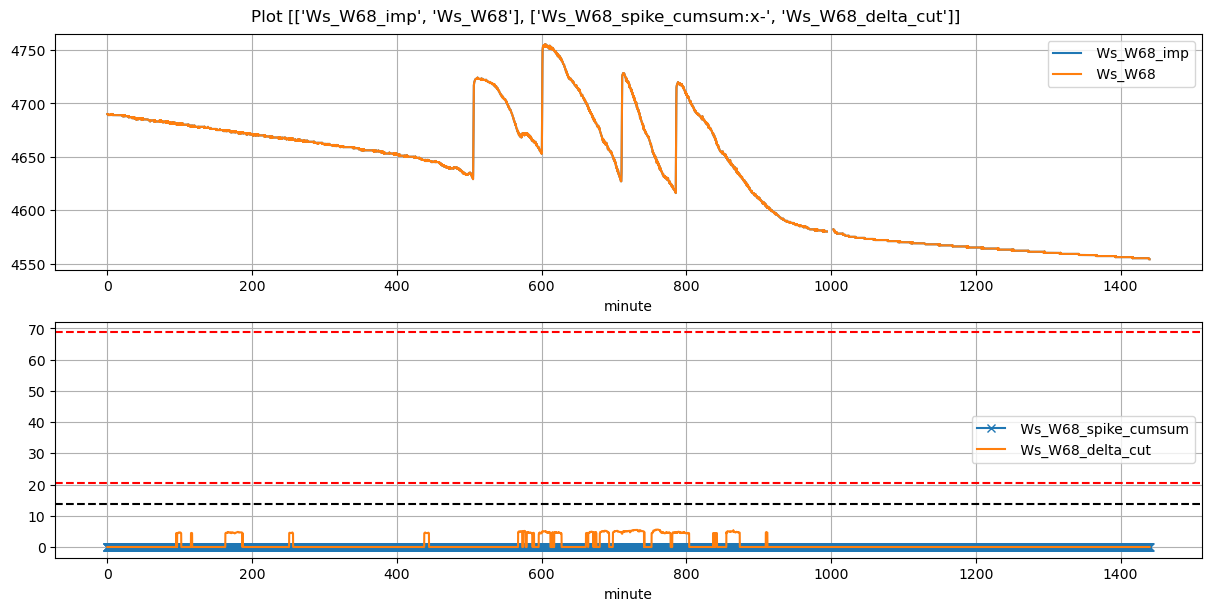
126 |
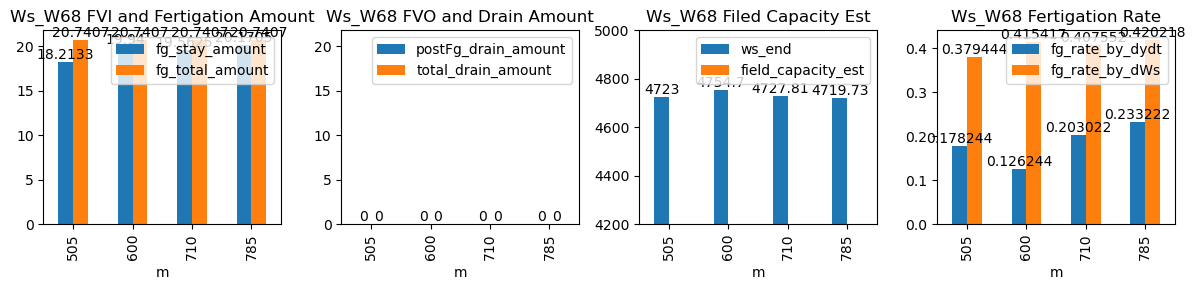
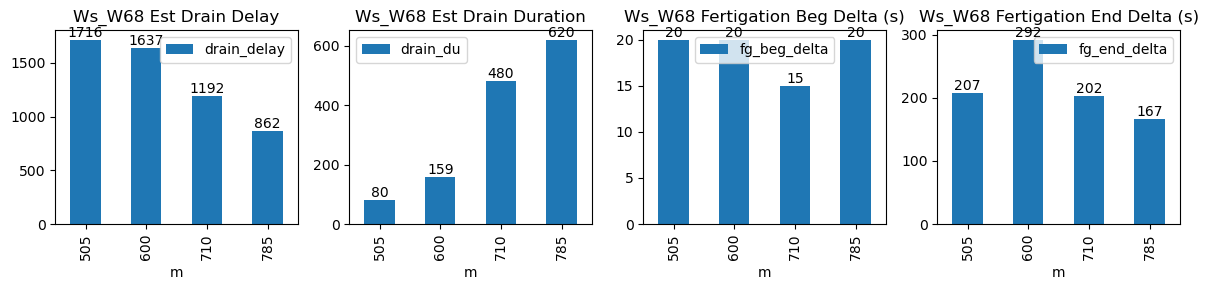
505 |
Ws_W68 |
0.2844 |
30 |
505.0 |
505.333333 |
505.8 |
509.250000 |
4631.933333 |
4723.0000 |
48 |
-0.009114 |
-0.011605 |
-0.077747 |
0.178244 |
0.379444 |
18.213333 |
True |
20.0 |
207.0 |
20.740741 |
0.0 |
0.0 |
0.0 |
80 |
1716 |
-0.016752 |
NaN |
| 2026-02-09 10:00:00+08:00 |
126 |
600 |
Ws_W68 |
0.2844 |
30 |
600.0 |
600.333333 |
600.8 |
605.666667 |
4655.000000 |
4754.7000 |
48 |
-0.079428 |
-0.034875 |
-0.120782 |
0.126244 |
0.415417 |
19.940000 |
True |
20.0 |
292.0 |
20.740741 |
0.0 |
0.0 |
0.0 |
159 |
1637 |
-0.046556 |
NaN |
| 2026-02-09 11:50:00+08:00 |
126 |
710 |
Ws_W68 |
0.2844 |
30 |
710.0 |
710.250000 |
710.8 |
714.166667 |
4630.000000 |
4727.8125 |
48 |
-0.168711 |
-0.138549 |
-0.130484 |
0.203022 |
0.407552 |
19.562500 |
True |
15.0 |
202.0 |
20.740741 |
0.0 |
0.0 |
0.0 |
480 |
1192 |
-0.055809 |
NaN |
| 2026-02-09 13:05:00+08:00 |
126 |
785 |
Ws_W68 |
0.2844 |
30 |
785.0 |
785.333333 |
785.8 |
788.583333 |
4618.872727 |
4719.7250 |
48 |
-0.084280 |
-0.091387 |
-0.056552 |
0.233222 |
0.420218 |
20.170455 |
True |
20.0 |
167.0 |
20.740741 |
0.0 |
0.0 |
0.0 |
620 |
862 |
-0.046246 |
NaN |