| 2026-02-08 08:25:00+08:00 |
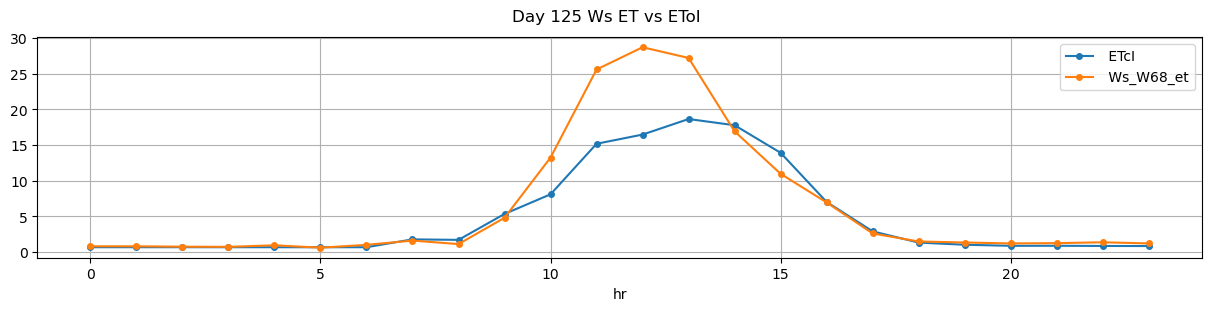
125 |
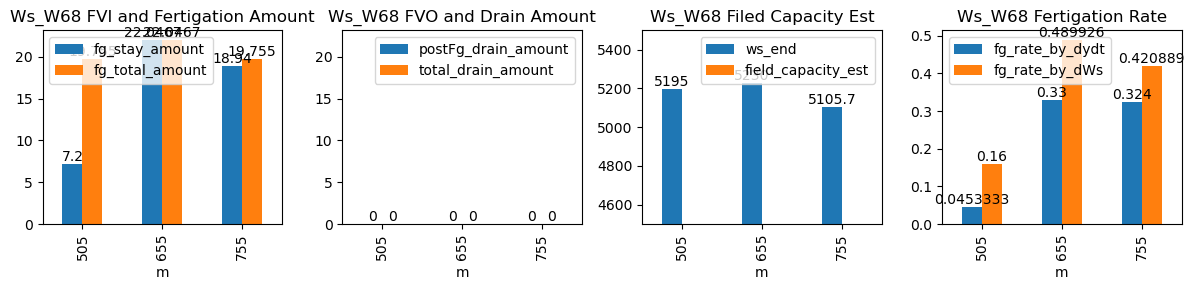
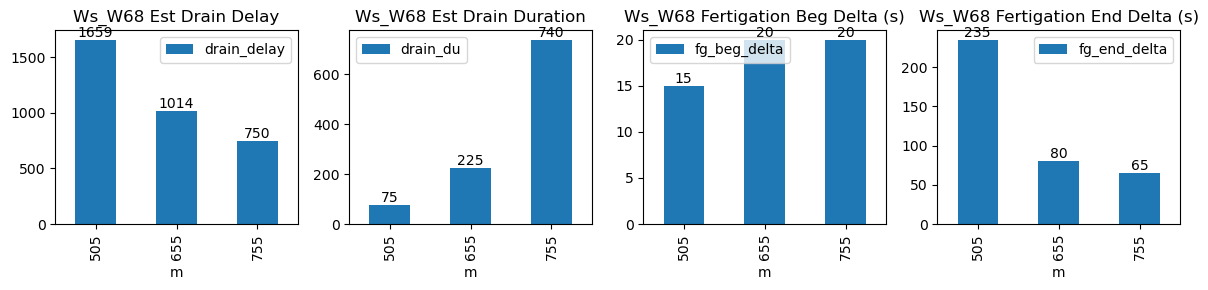
505 |
Ws_W68 |
0.399043 |
30 |
505.0 |
505.250000 |
505.75 |
509.500000 |
5159.0 |
5195.0 |
45 |
-0.032203 |
0.000000 |
-0.011852 |
0.052889 |
0.160000 |
7.2 |
True |
15.0 |
225.0 |
20.205 |
0.0 |
0 |
0.0 |
35 |
459 |
-0.203990 |
NaN |
| 2026-02-08 10:55:00+08:00 |
125 |
655 |
Ws_W68 |
0.399043 |
30 |
655.0 |
655.333333 |
655.75 |
656.916667 |
5119.0 |
5230.0 |
45 |
-0.152425 |
-0.166065 |
-0.176104 |
0.338667 |
0.493333 |
22.2 |
True |
20.0 |
70.0 |
22.200 |
0.0 |
0 |
0.0 |
10 |
204 |
-0.338600 |
NaN |
| 2026-02-08 12:35:00+08:00 |
125 |
755 |
Ws_W68 |
0.399043 |
30 |
755.0 |
755.333333 |
755.75 |
756.916667 |
5010.0 |
5106.0 |
45 |
-0.224741 |
-0.185754 |
-0.181667 |
0.323111 |
0.426667 |
19.2 |
True |
20.0 |
70.0 |
20.205 |
0.0 |
0 |
0.0 |
19 |
245 |
-0.250673 |
NaN |