VI and VO Daily Summary
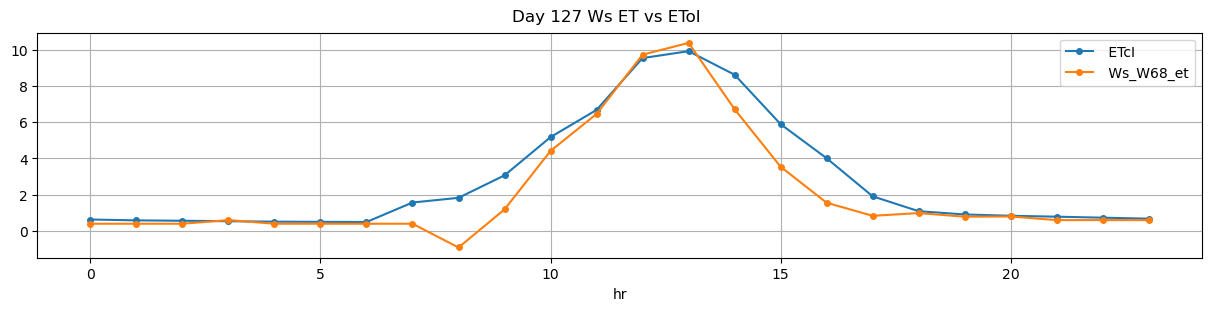
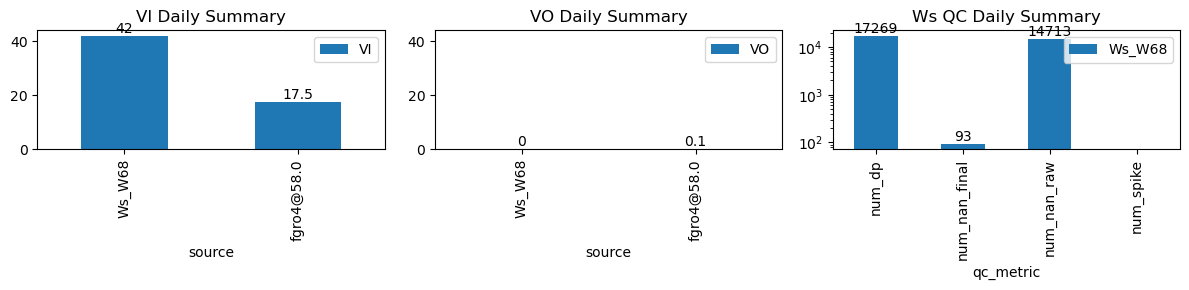
| ws_name | num_dp | num_nan_raw | num_nan_final | num_spike | cum_step_adj |
|---|---|---|---|---|---|
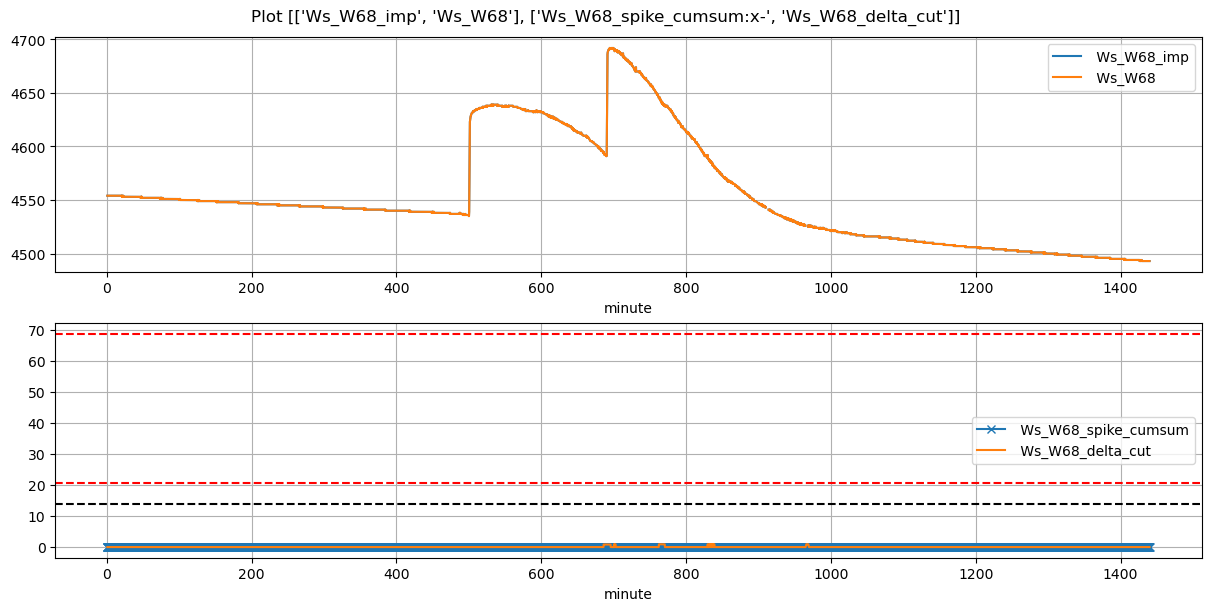
| Ws_W68 | 17,269 | 14,713 | 93 | 0 | 0.00 |
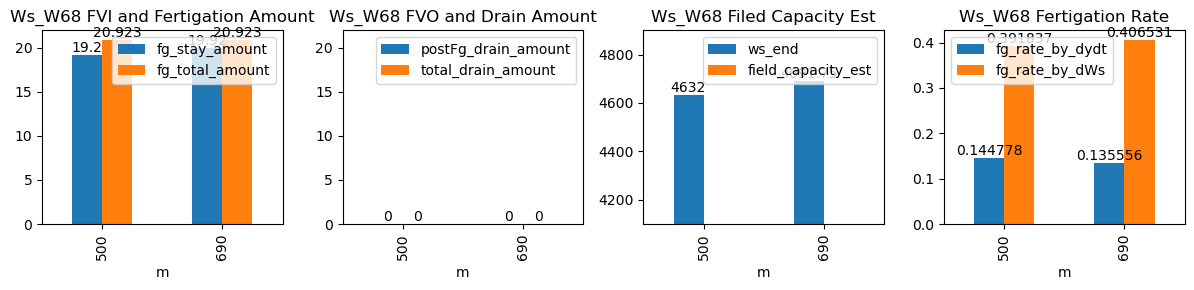
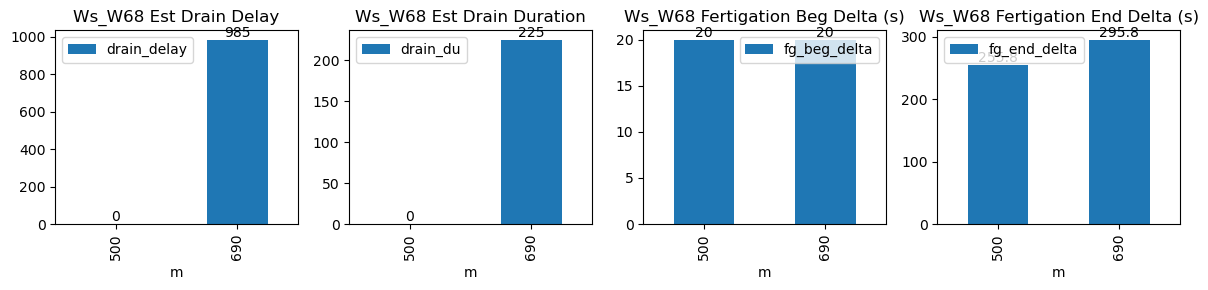
| ds | d | m | ws_name | prominence_cut | max_drain_du | fg_beg | fg_beg_est | fg_end | fg_end_est | ws_beg | ws_end | duc | pre_fg_et | post_fg_ws | post_drn_et | fg_rate_by_dydt | fg_rate_by_dWs | fg_stay_amount | enough_data | fg_beg_delta | fg_end_delta | fg_total_amount | fg_drain_amount | postFg_drain_amount | total_drain_amount | drain_du | drain_delay | drain_rate | field_capacity_est |
|---|---|---|---|---|---|---|---|---|---|---|---|---|---|---|---|---|---|---|---|---|---|---|---|---|---|---|---|---|---|
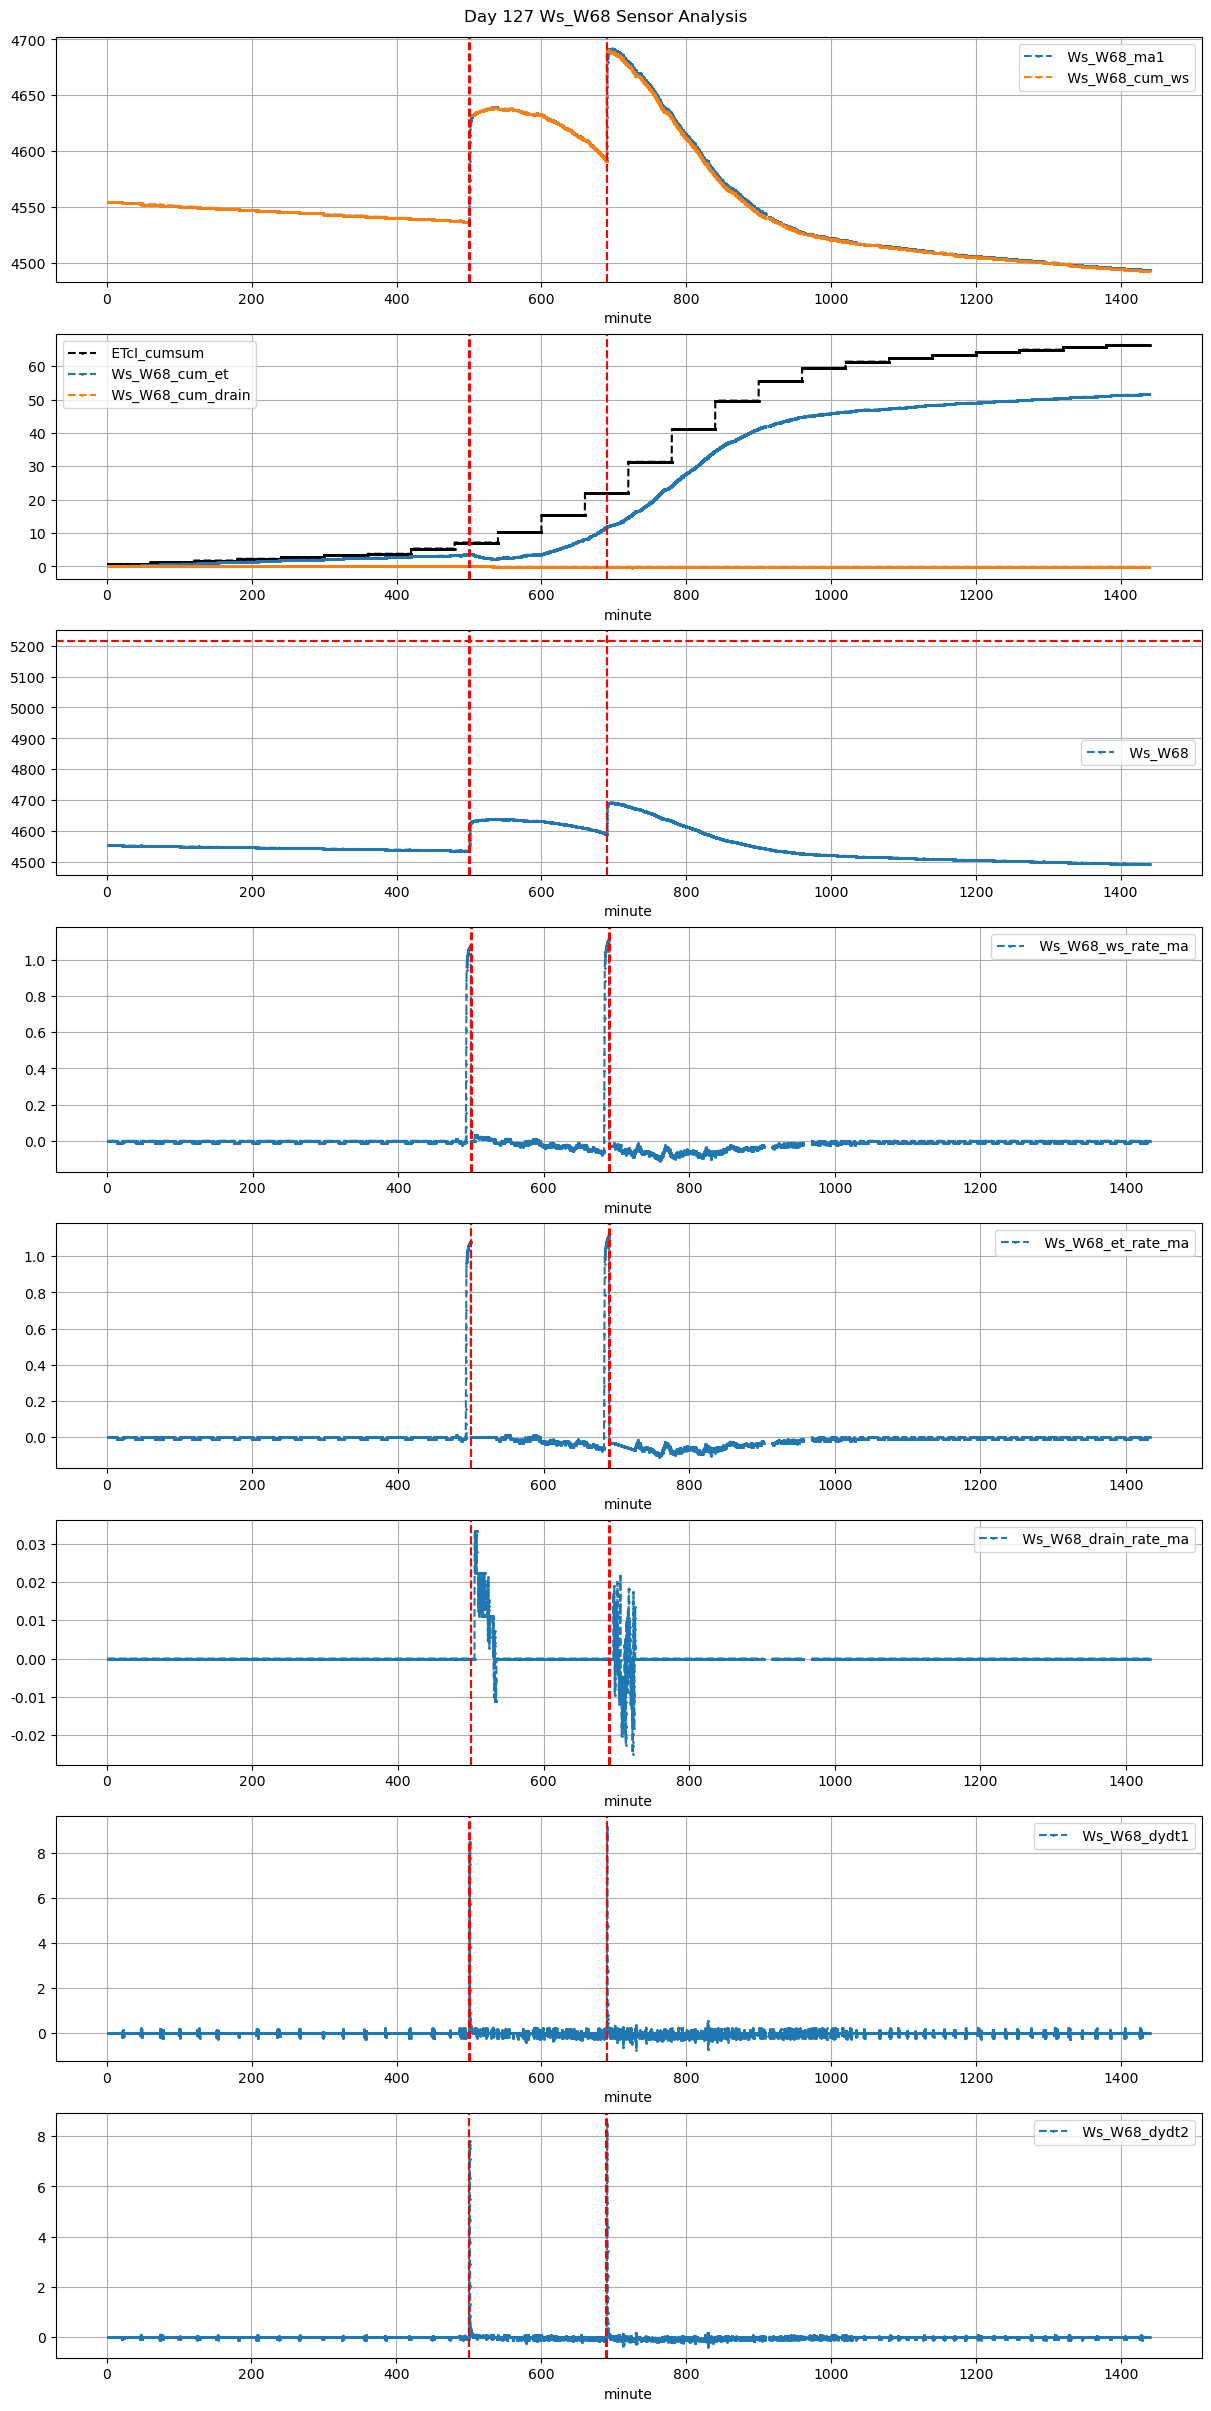
| 2026-02-10 08:20:00+08:00 | 127 | 500 | Ws_W68 | 0.193964 | 30 | 500.0 | 500.333333 | 500.82 | 504.916667 | 4536.0 | 4632.0 | 49 | -0.005968 | 0.000000 | 0.000000 | 0.151667 | 0.391837 | 19.2 | True | 20.0 | 245.8 | 21.17284 | 0.0 | 0 | 0.0 | 10 | 580 | -0.214062 | NaN |
| 2026-02-10 11:30:00+08:00 | 127 | 690 | Ws_W68 | 0.193964 | 30 | 690.0 | 690.333333 | 690.82 | 694.583333 | 4592.0 | 4692.0 | 49 | -0.063136 | -0.020833 | -0.072292 | 0.175926 | 0.408163 | 20.0 | True | 20.0 | 225.8 | 21.17284 | 0.0 | 0 | 0.0 | 24 | 840 | -0.209522 | NaN |