| 2026-02-11 08:20:00+08:00 |
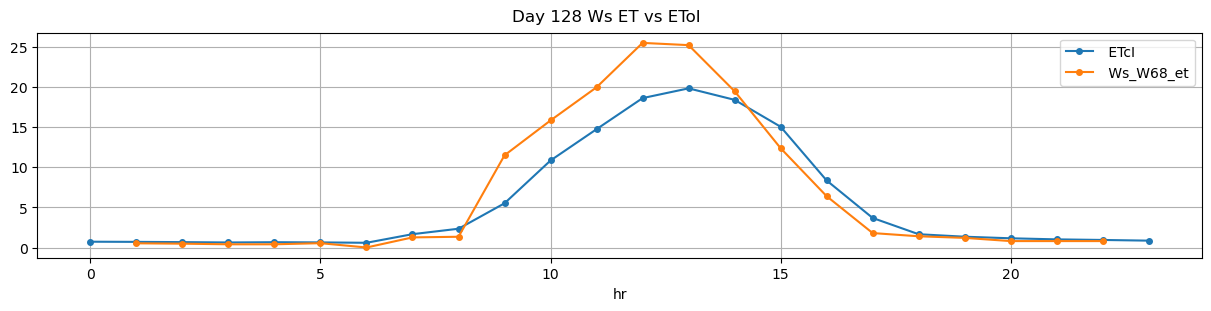
128 |
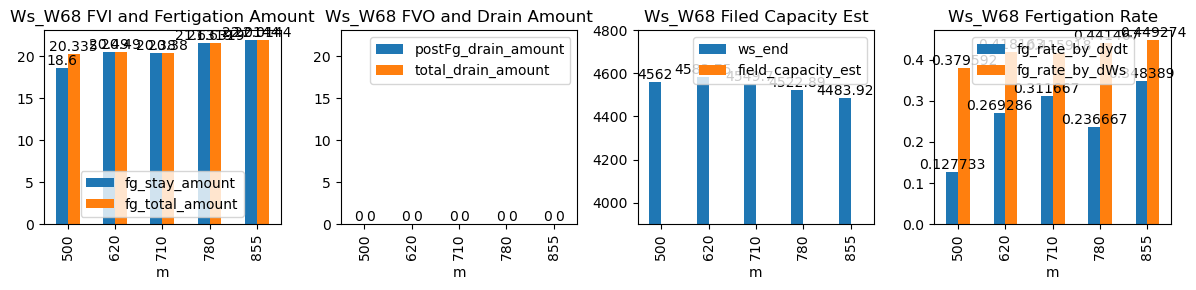
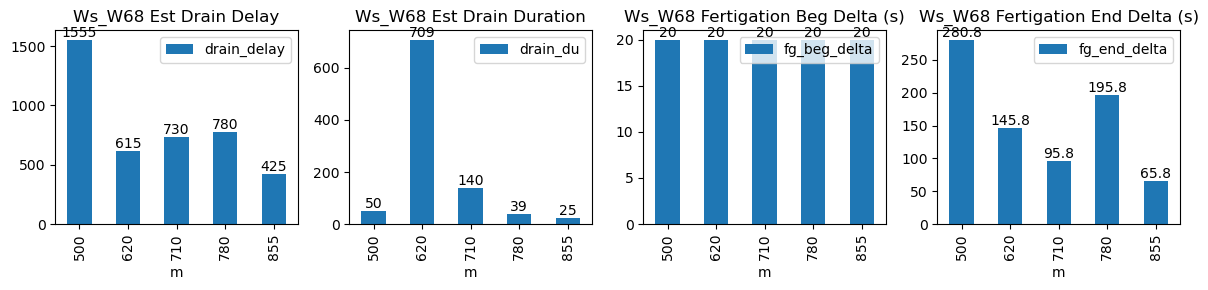
500 |
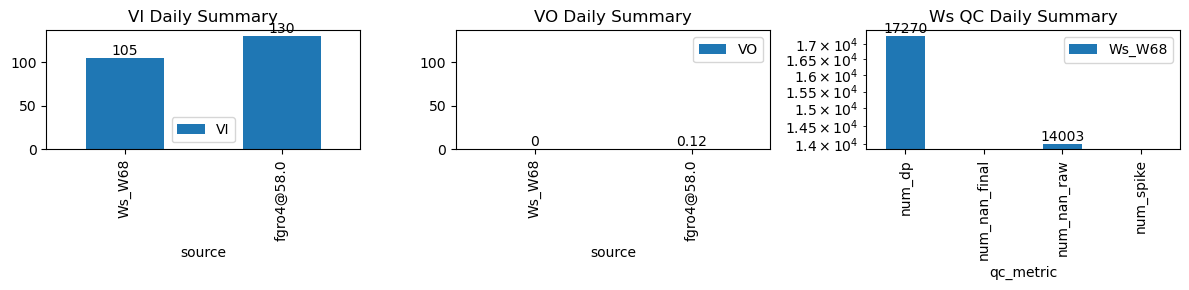
Ws_W68 |
0.372813 |
30 |
500.0 |
500.333333 |
500.82 |
505.500000 |
4469.000000 |
4562.000000 |
49 |
-0.016067 |
0.000000 |
-0.030123 |
0.127733 |
0.379592 |
18.600000 |
True |
20.0 |
280.8 |
20.335000 |
0.0 |
0 |
0.0 |
50 |
1555 |
-0.008878 |
NaN |
| 2026-02-11 10:20:00+08:00 |
128 |
620 |
Ws_W68 |
0.372813 |
30 |
620.0 |
620.333333 |
620.82 |
623.250000 |
4481.300000 |
4583.750000 |
49 |
-0.117925 |
-0.102469 |
-0.124760 |
0.269286 |
0.418163 |
20.490000 |
True |
20.0 |
145.8 |
20.490000 |
0.0 |
0 |
0.0 |
709 |
615 |
-0.031481 |
NaN |
| 2026-02-11 11:50:00+08:00 |
128 |
710 |
Ws_W68 |
0.372813 |
30 |
710.0 |
710.333333 |
710.82 |
712.416667 |
4447.800000 |
4549.700000 |
49 |
-0.161434 |
-0.130997 |
-0.180710 |
0.311667 |
0.415918 |
20.380000 |
True |
20.0 |
95.8 |
20.380000 |
0.0 |
0 |
0.0 |
140 |
730 |
-0.025742 |
NaN |
| 2026-02-11 13:00:00+08:00 |
128 |
780 |
Ws_W68 |
0.372813 |
30 |
780.0 |
780.333333 |
780.82 |
784.083333 |
4414.733333 |
4522.892857 |
49 |
-0.204650 |
-0.172647 |
-0.184578 |
0.236667 |
0.441467 |
21.631905 |
True |
20.0 |
195.8 |
21.631905 |
0.0 |
0 |
0.0 |
39 |
780 |
-0.026145 |
NaN |
| 2026-02-11 14:15:00+08:00 |
128 |
855 |
Ws_W68 |
0.372813 |
30 |
855.0 |
855.333333 |
855.82 |
856.916667 |
4373.844444 |
4483.916667 |
49 |
-0.188806 |
-0.125548 |
-0.135823 |
0.348389 |
0.449274 |
22.014444 |
True |
20.0 |
65.8 |
22.014444 |
0.0 |
0 |
0.0 |
25 |
425 |
-0.016255 |
NaN |