| 2026-02-19 08:15:00+08:00 |
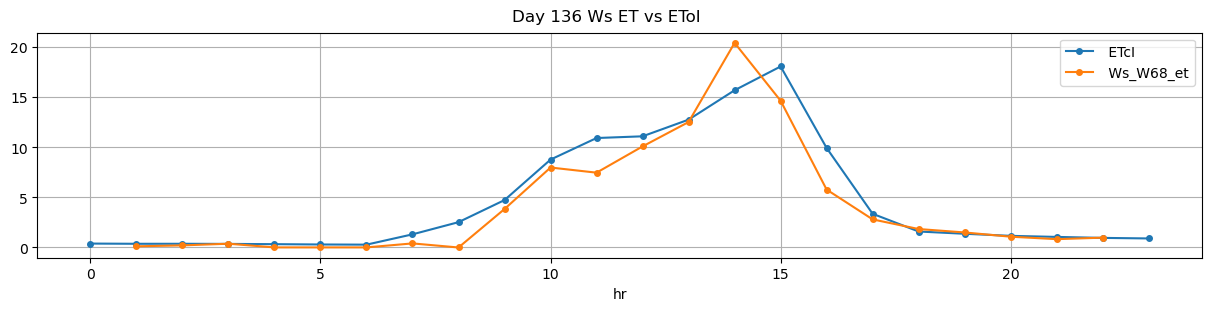
136 |
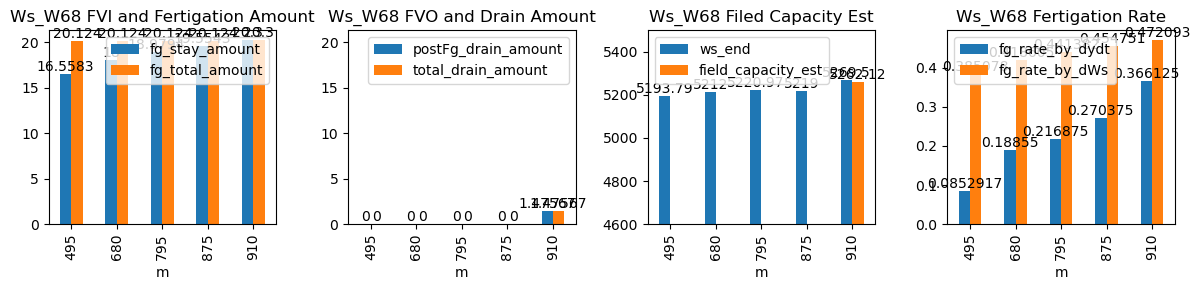
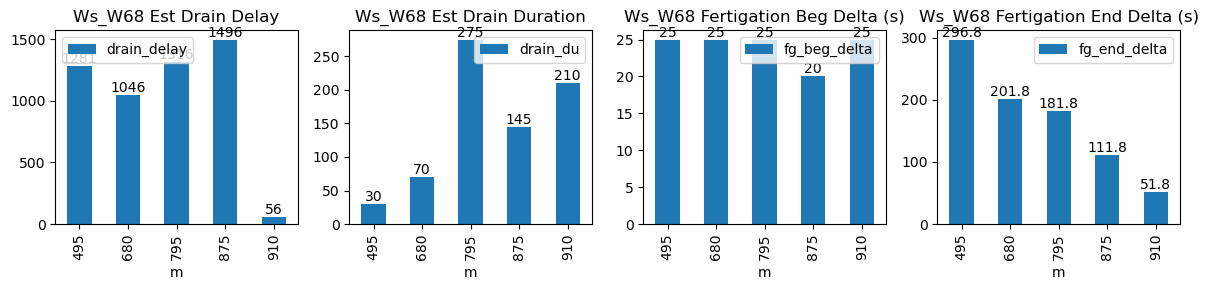
495 |
Ws_W68 |
0.258122 |
30 |
495.0 |
495.416667 |
495.72 |
500.666667 |
5111.000000 |
5193.791667 |
43 |
-0.004182 |
0.000000 |
-0.007757 |
0.085292 |
0.385078 |
16.558333 |
True |
25.0 |
296.8 |
20.124 |
0.0 |
0.000000 |
0.000000 |
30 |
1281 |
-0.005466 |
NaN |
| 2026-02-19 11:20:00+08:00 |
136 |
680 |
Ws_W68 |
0.258122 |
30 |
680.0 |
680.416667 |
680.72 |
684.083333 |
5122.000000 |
5212.000000 |
43 |
-0.059444 |
-0.040622 |
-0.059012 |
0.188550 |
0.418605 |
18.000000 |
True |
25.0 |
201.8 |
20.124 |
0.0 |
0.000000 |
0.000000 |
70 |
1046 |
-0.012412 |
NaN |
| 2026-02-19 13:15:00+08:00 |
136 |
795 |
Ws_W68 |
0.258122 |
30 |
795.0 |
795.416667 |
795.72 |
798.750000 |
5126.075000 |
5220.972222 |
43 |
-0.088955 |
-0.062716 |
-0.111798 |
0.216875 |
0.441382 |
18.979444 |
True |
25.0 |
181.8 |
20.124 |
0.0 |
0.000000 |
0.000000 |
275 |
1316 |
-0.014024 |
NaN |
| 2026-02-19 14:35:00+08:00 |
136 |
875 |
Ws_W68 |
0.258122 |
30 |
875.0 |
875.333333 |
875.72 |
877.583333 |
5121.228571 |
5219.000000 |
43 |
-0.164687 |
-0.154222 |
0.000000 |
0.270375 |
0.454751 |
19.554286 |
True |
20.0 |
111.8 |
20.124 |
0.0 |
0.000000 |
0.000000 |
145 |
1496 |
-0.094226 |
NaN |
| 2026-02-19 15:10:00+08:00 |
136 |
910 |
Ws_W68 |
0.258122 |
30 |
910.0 |
910.416667 |
910.72 |
911.583333 |
5168.000000 |
5269.500000 |
43 |
-0.125590 |
-0.138128 |
-0.098867 |
0.366125 |
0.472093 |
20.300000 |
True |
25.0 |
51.8 |
20.300 |
0.0 |
1.475672 |
1.475672 |
210 |
56 |
-0.062138 |
5262.121639 |