| 2025-11-17 07:10:00+08:00 |
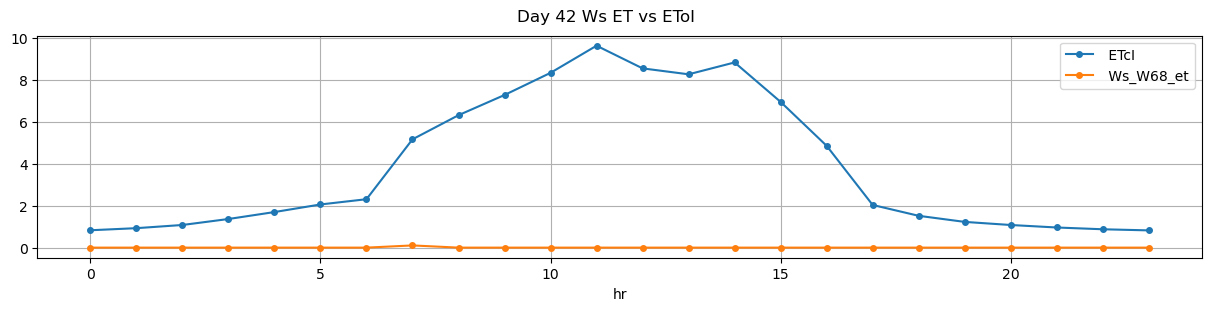
42 |
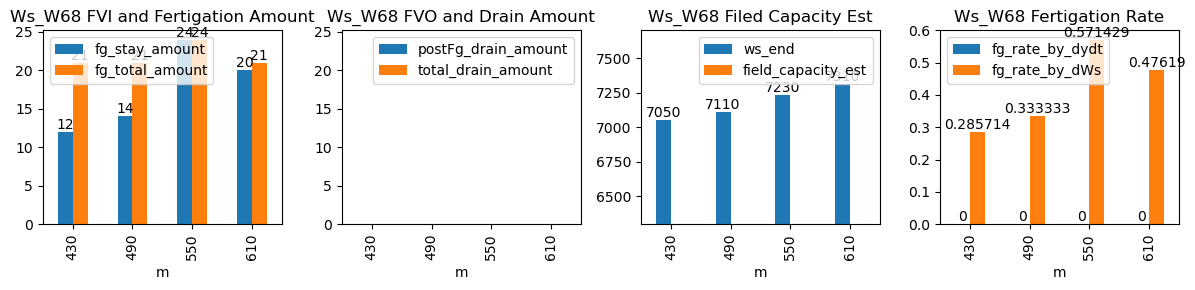
430 |
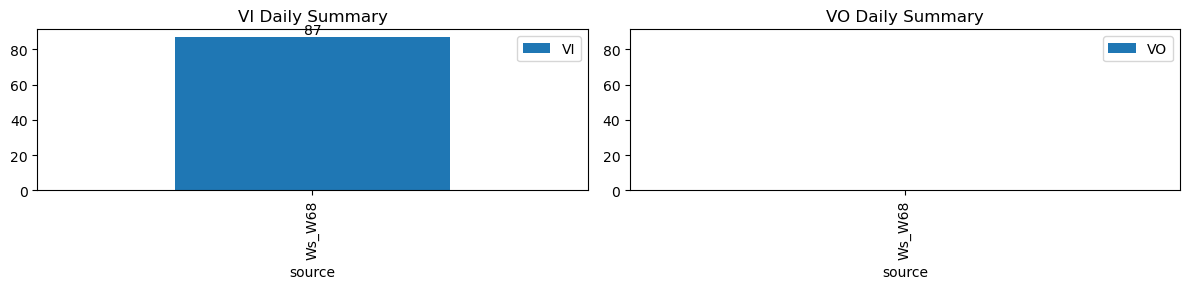
Ws_W68 |
2.409705 |
30 |
430.0 |
430.666667 |
430.7 |
430.75 |
NaN |
NaN |
NaN |
6990.0 |
7050.0 |
42 |
0.0 |
0.000000 |
-0.002894 |
NaN |
0.285714 |
12.0 |
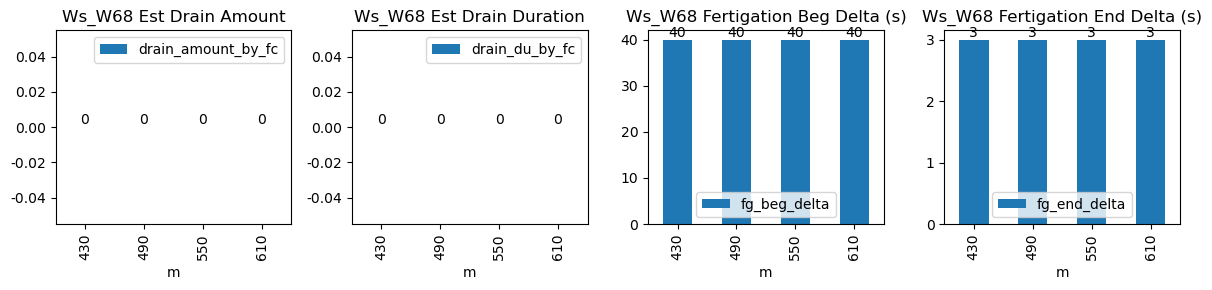
40.0 |
3.0 |
21.0 |
9.0 |
-10.104744 |
NaN |
-1.104744 |
| 2025-11-17 08:10:00+08:00 |
42 |
490 |
Ws_W68 |
2.409705 |
30 |
490.0 |
490.666667 |
490.7 |
490.75 |
NaN |
NaN |
NaN |
7040.0 |
7110.0 |
42 |
0.0 |
0.000000 |
0.000000 |
NaN |
0.333333 |
14.0 |
40.0 |
3.0 |
21.0 |
7.0 |
-14.000000 |
NaN |
-7.000000 |
| 2025-11-17 09:10:00+08:00 |
42 |
550 |
Ws_W68 |
2.409705 |
30 |
550.0 |
550.666667 |
550.7 |
550.75 |
NaN |
NaN |
NaN |
7110.0 |
7230.0 |
42 |
0.0 |
0.000000 |
0.000000 |
NaN |
0.571429 |
24.0 |
40.0 |
3.0 |
24.0 |
0.0 |
-20.000000 |
NaN |
-20.000000 |
| 2025-11-17 10:10:00+08:00 |
42 |
610 |
Ws_W68 |
2.409705 |
30 |
610.0 |
610.666667 |
610.7 |
610.75 |
NaN |
NaN |
NaN |
7210.0 |
7310.0 |
42 |
0.0 |
-0.158333 |
0.000000 |
NaN |
0.476190 |
20.0 |
40.0 |
3.0 |
21.0 |
1.0 |
-12.000000 |
NaN |
-11.000000 |