| 2025-11-21 08:50:00+08:00 |
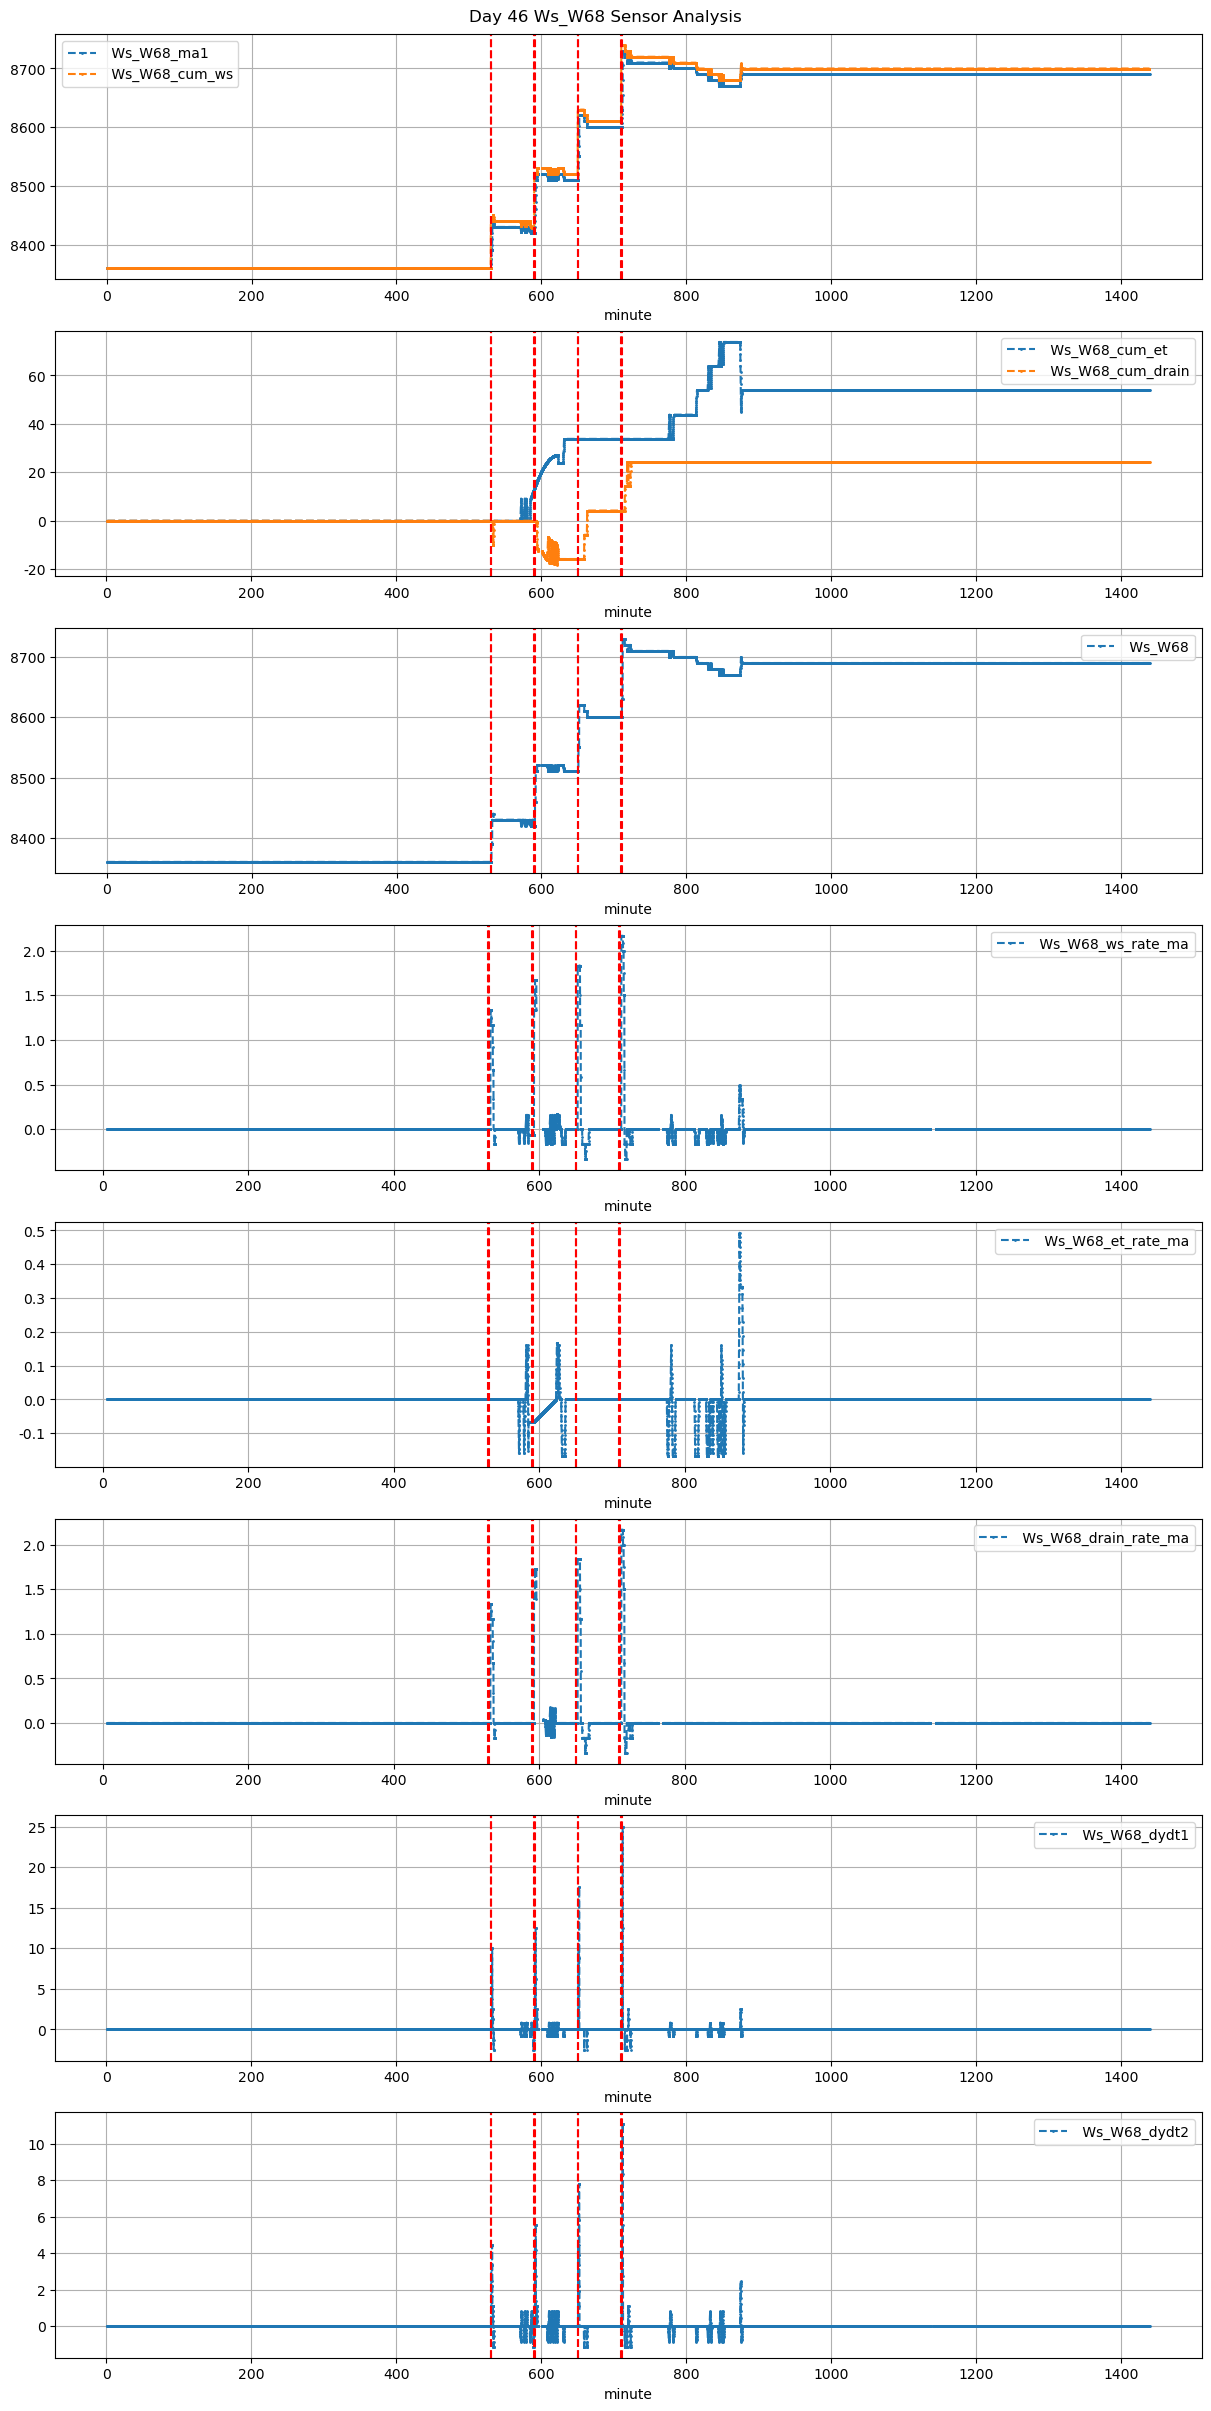
46 |
530 |
Ws_W68 |
1.588481 |
30 |
530.0 |
530.583333 |
530.8 |
532.666667 |
NaN |
NaN |
NaN |
8360.0 |
8440.0 |
48 |
0.000000 |
-0.033333 |
0.0 |
0.177778 |
0.333333 |
16.0 |
35.0 |
112.0 |
24.0 |
8.0 |
0.000000 |
NaN |
8.000000 |
| 2025-11-21 09:50:00+08:00 |
46 |
590 |
Ws_W68 |
1.588481 |
30 |
590.0 |
590.583333 |
590.8 |
592.666667 |
NaN |
NaN |
NaN |
8425.0 |
8520.0 |
48 |
-0.066384 |
NaN |
0.0 |
0.222222 |
0.395833 |
19.0 |
35.0 |
112.0 |
24.0 |
5.0 |
-3.482872 |
NaN |
1.517128 |
| 2025-11-21 10:50:00+08:00 |
46 |
650 |
Ws_W68 |
1.588481 |
30 |
650.0 |
650.583333 |
650.8 |
652.666667 |
NaN |
NaN |
NaN |
8510.0 |
8620.0 |
48 |
0.000000 |
-0.120833 |
0.0 |
0.311111 |
0.458333 |
22.0 |
35.0 |
112.0 |
24.0 |
2.0 |
4.000000 |
NaN |
6.000000 |
| 2025-11-21 11:50:00+08:00 |
46 |
710 |
Ws_W68 |
1.588481 |
30 |
710.0 |
710.583333 |
710.8 |
712.666667 |
NaN |
NaN |
NaN |
8600.0 |
8730.0 |
48 |
0.000000 |
-0.145833 |
0.0 |
0.444444 |
0.541667 |
26.0 |
35.0 |
112.0 |
26.0 |
0.0 |
4.000000 |
NaN |
4.000000 |