| 2025-11-20 08:25:00+08:00 |
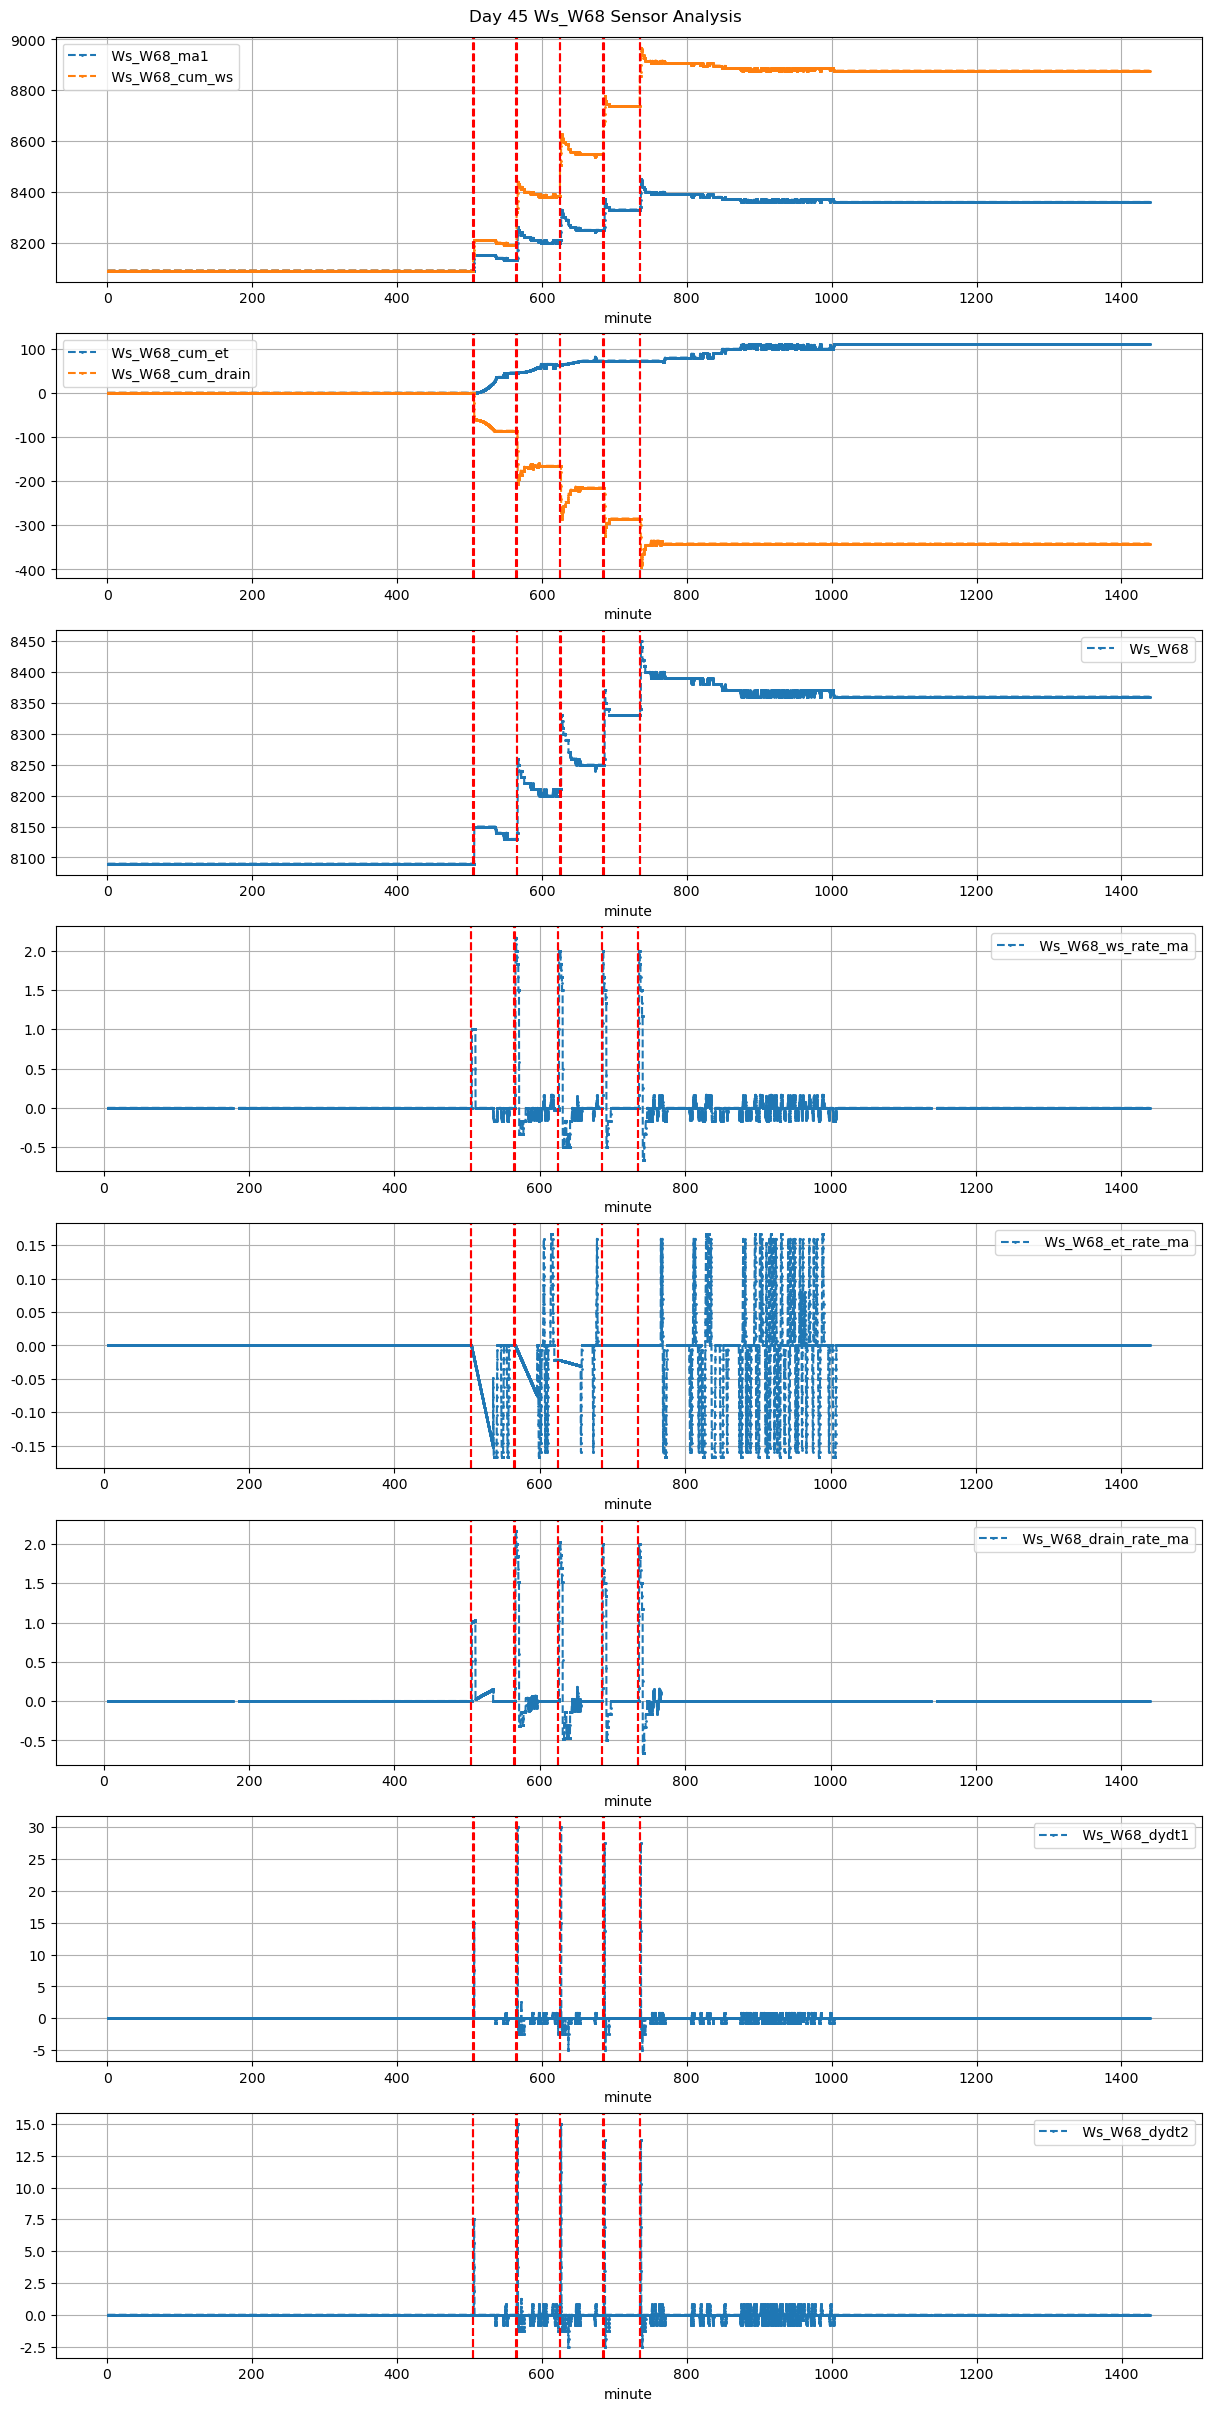
45 |
505 |
Ws_W68 |
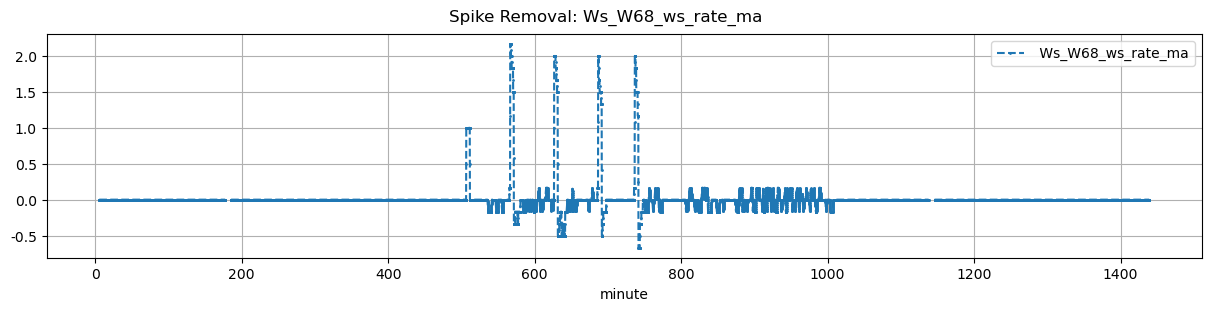
2.004589 |
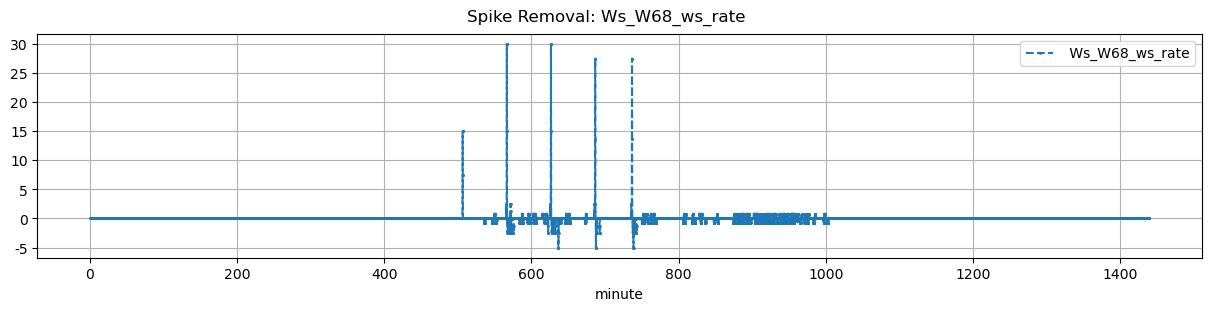
30 |
505.0 |
505.666667 |
505.72 |
505.750000 |
NaN |
NaN |
NaN |
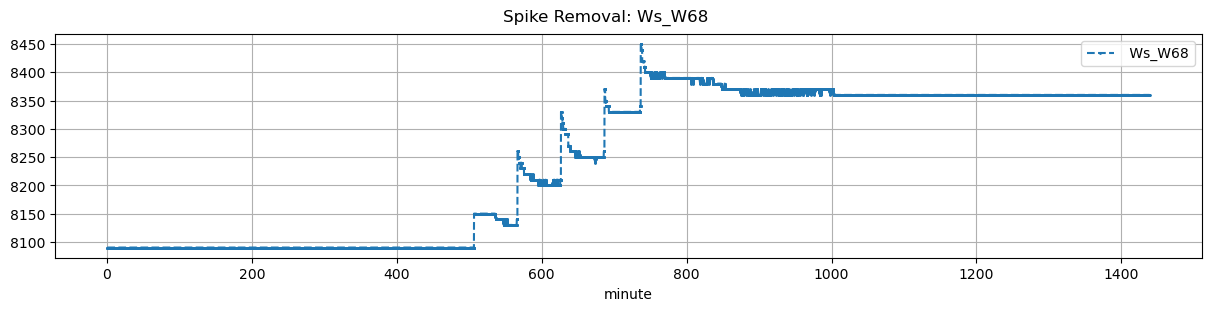
8090.0 |
8150.0 |
43 |
0.000000 |
0.000000 |
-0.152546 |
NaN |
0.279070 |
12.0 |
40.0 |
1.8 |
21.5 |
9.5 |
-17.188758 |
NaN |
-7.688758 |
| 2025-11-20 09:25:00+08:00 |
45 |
565 |
Ws_W68 |
2.004589 |
30 |
565.0 |
565.333333 |
565.72 |
566.166667 |
NaN |
NaN |
NaN |
8130.0 |
8260.0 |
43 |
0.000000 |
-0.080556 |
-0.075000 |
0.05 |
0.604651 |
26.0 |
20.0 |
26.8 |
26.0 |
0.0 |
-14.973749 |
NaN |
-14.973749 |
| 2025-11-20 10:25:00+08:00 |
45 |
625 |
Ws_W68 |
2.004589 |
30 |
625.0 |
625.333333 |
625.72 |
626.166667 |
NaN |
NaN |
NaN |
8205.0 |
8330.0 |
43 |
-0.021304 |
-0.180556 |
-0.030440 |
0.05 |
0.581395 |
25.0 |
20.0 |
26.8 |
25.0 |
0.0 |
-9.838481 |
NaN |
-9.838481 |
| 2025-11-20 11:25:00+08:00 |
45 |
685 |
Ws_W68 |
2.004589 |
30 |
685.0 |
685.333333 |
685.72 |
686.333333 |
NaN |
NaN |
NaN |
8250.0 |
8370.0 |
43 |
0.000000 |
-0.154167 |
0.000000 |
0.05 |
0.558140 |
24.0 |
20.0 |
36.8 |
24.0 |
0.0 |
-14.000000 |
NaN |
-14.000000 |
| 2025-11-20 12:15:00+08:00 |
45 |
735 |
Ws_W68 |
2.004589 |
30 |
735.0 |
735.333333 |
735.72 |
736.333333 |
NaN |
NaN |
NaN |
8330.0 |
8450.0 |
43 |
0.000000 |
-0.333333 |
0.000000 |
0.05 |
0.558140 |
24.0 |
20.0 |
36.8 |
24.0 |
0.0 |
-10.208333 |
NaN |
-10.208333 |