| 2025-12-07 08:10:00+08:00 |
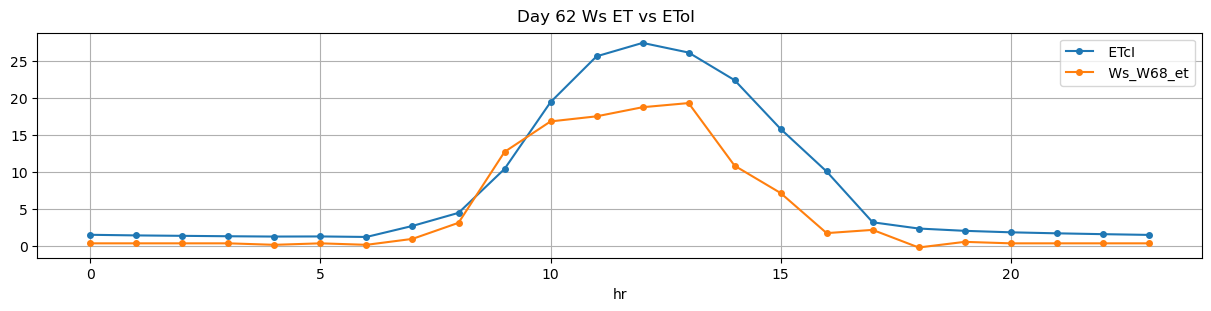
62 |
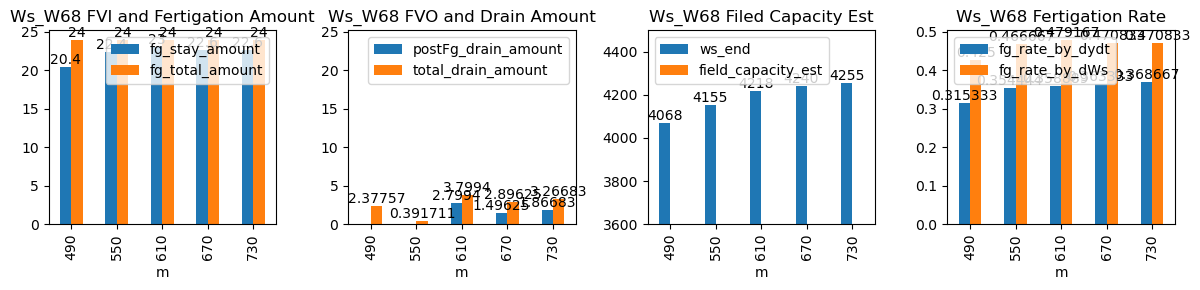
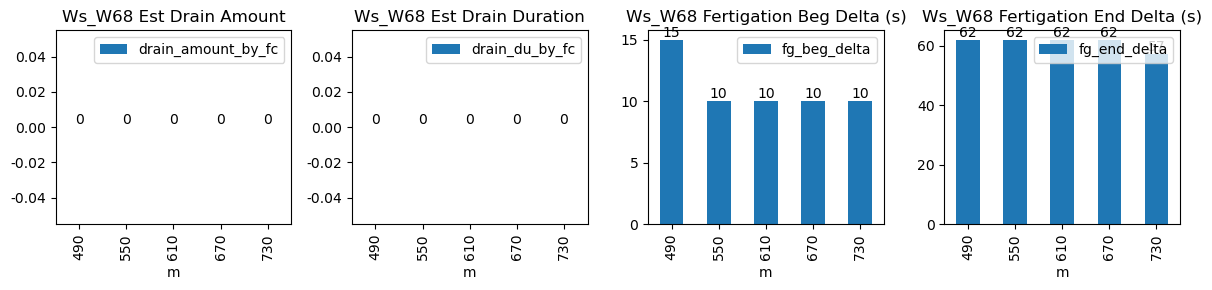
490 |
Ws_W68 |
0.35674 |
30 |
490.0 |
490.250000 |
490.8 |
491.833333 |
NaN |
NaN |
NaN |
3966.0 |
4068.0 |
48 |
-0.031097 |
0.000000 |
-0.041431 |
0.315333 |
0.425000 |
20.4 |
15.0 |
62.0 |
24.0 |
3.6 |
-1.222428 |
NaN |
2.377572 |
| 2025-12-07 09:10:00+08:00 |
62 |
550 |
Ws_W68 |
0.35674 |
30 |
550.0 |
550.166667 |
550.8 |
551.833333 |
NaN |
NaN |
NaN |
4043.0 |
4155.0 |
48 |
-0.071654 |
-0.046111 |
-0.112304 |
0.354444 |
0.466667 |
22.4 |
10.0 |
62.0 |
24.0 |
1.6 |
-1.208289 |
NaN |
0.391711 |
| 2025-12-07 10:10:00+08:00 |
62 |
610 |
Ws_W68 |
0.35674 |
30 |
610.0 |
610.166667 |
610.8 |
611.833333 |
NaN |
NaN |
NaN |
4103.0 |
4218.0 |
48 |
-0.050989 |
-0.152222 |
-0.140694 |
0.358889 |
0.479167 |
23.0 |
10.0 |
62.0 |
24.0 |
1.0 |
2.799404 |
NaN |
3.799404 |
| 2025-12-07 11:10:00+08:00 |
62 |
670 |
Ws_W68 |
0.35674 |
30 |
670.0 |
670.166667 |
670.8 |
671.833333 |
NaN |
NaN |
NaN |
4127.0 |
4240.0 |
48 |
-0.126530 |
-0.146667 |
-0.142694 |
0.363333 |
0.470833 |
22.6 |
10.0 |
62.0 |
24.0 |
1.4 |
1.496252 |
NaN |
2.896252 |
| 2025-12-07 12:10:00+08:00 |
62 |
730 |
Ws_W68 |
0.35674 |
30 |
730.0 |
730.166667 |
730.8 |
731.750000 |
NaN |
NaN |
NaN |
4142.0 |
4255.0 |
48 |
-0.130226 |
-0.167361 |
-0.132940 |
0.368667 |
0.470833 |
22.6 |
10.0 |
57.0 |
24.0 |
1.4 |
1.866828 |
NaN |
3.266828 |