| 2025-12-08 08:10:00+08:00 |
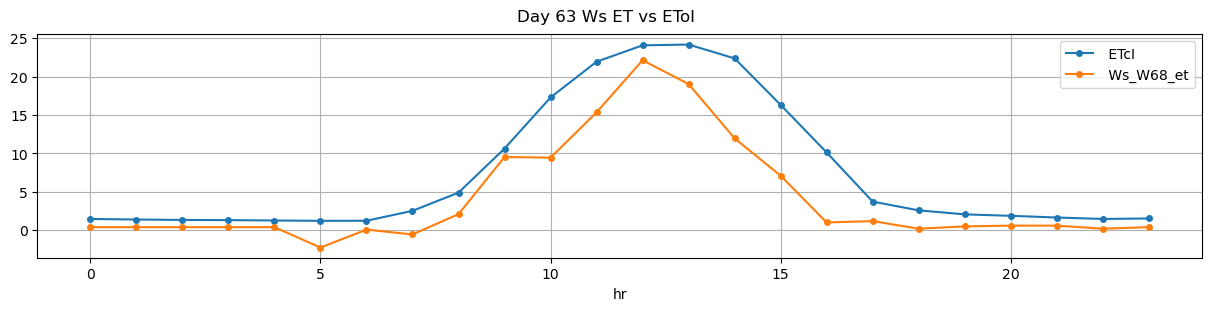
63 |
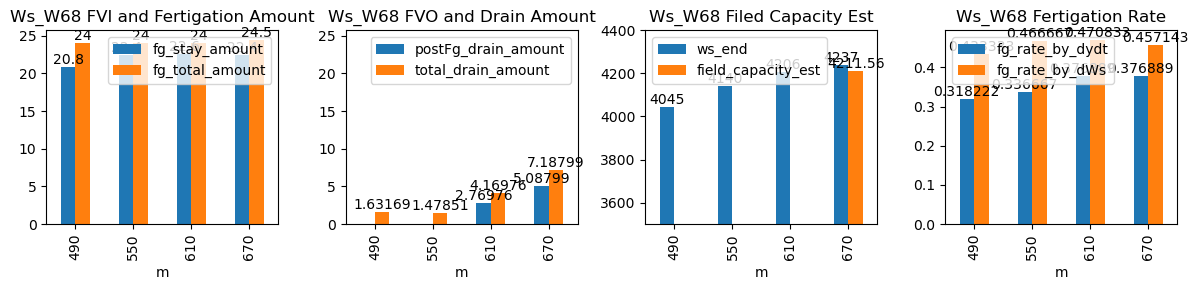
490 |
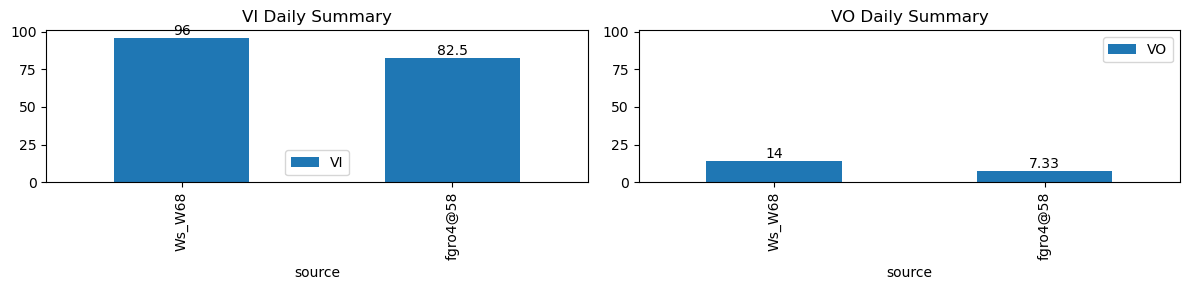
Ws_W68 |
0.357517 |
30 |
490.0 |
490.250000 |
490.80 |
491.833333 |
NaN |
NaN |
NaN |
3941.0 |
4045.0 |
48 |
-0.019492 |
0.000000 |
-0.030012 |
0.318222 |
0.433333 |
20.8 |
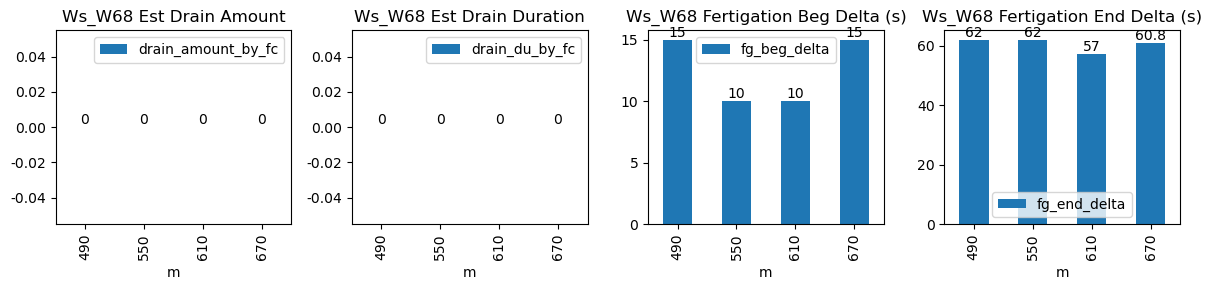
15.0 |
62.0 |
24.0 |
3.2 |
-1.568309 |
NaN |
1.631691 |
| 2025-12-08 09:10:00+08:00 |
63 |
550 |
Ws_W68 |
0.357517 |
30 |
550.0 |
550.166667 |
550.80 |
551.833333 |
NaN |
NaN |
NaN |
4028.0 |
4140.0 |
48 |
-0.047293 |
-0.024306 |
-0.066419 |
0.336667 |
0.466667 |
22.4 |
10.0 |
62.0 |
24.0 |
1.6 |
-0.121490 |
NaN |
1.478510 |
| 2025-12-08 10:10:00+08:00 |
63 |
610 |
Ws_W68 |
0.357517 |
30 |
610.0 |
610.166667 |
610.80 |
611.750000 |
NaN |
NaN |
NaN |
4093.0 |
4206.0 |
48 |
-0.092655 |
-0.161528 |
-0.102407 |
0.376889 |
0.470833 |
22.6 |
10.0 |
57.0 |
24.0 |
1.4 |
2.769758 |
NaN |
4.169758 |
| 2025-12-08 11:10:00+08:00 |
63 |
670 |
Ws_W68 |
0.357517 |
30 |
670.0 |
670.250000 |
670.82 |
671.833333 |
NaN |
NaN |
NaN |
4125.0 |
4237.0 |
49 |
-0.102024 |
-0.175417 |
-0.098056 |
0.376889 |
0.457143 |
22.4 |
15.0 |
60.8 |
24.5 |
2.1 |
5.087986 |
4211.56007 |
7.187986 |