| 2025-12-11 09:10:00+08:00 |
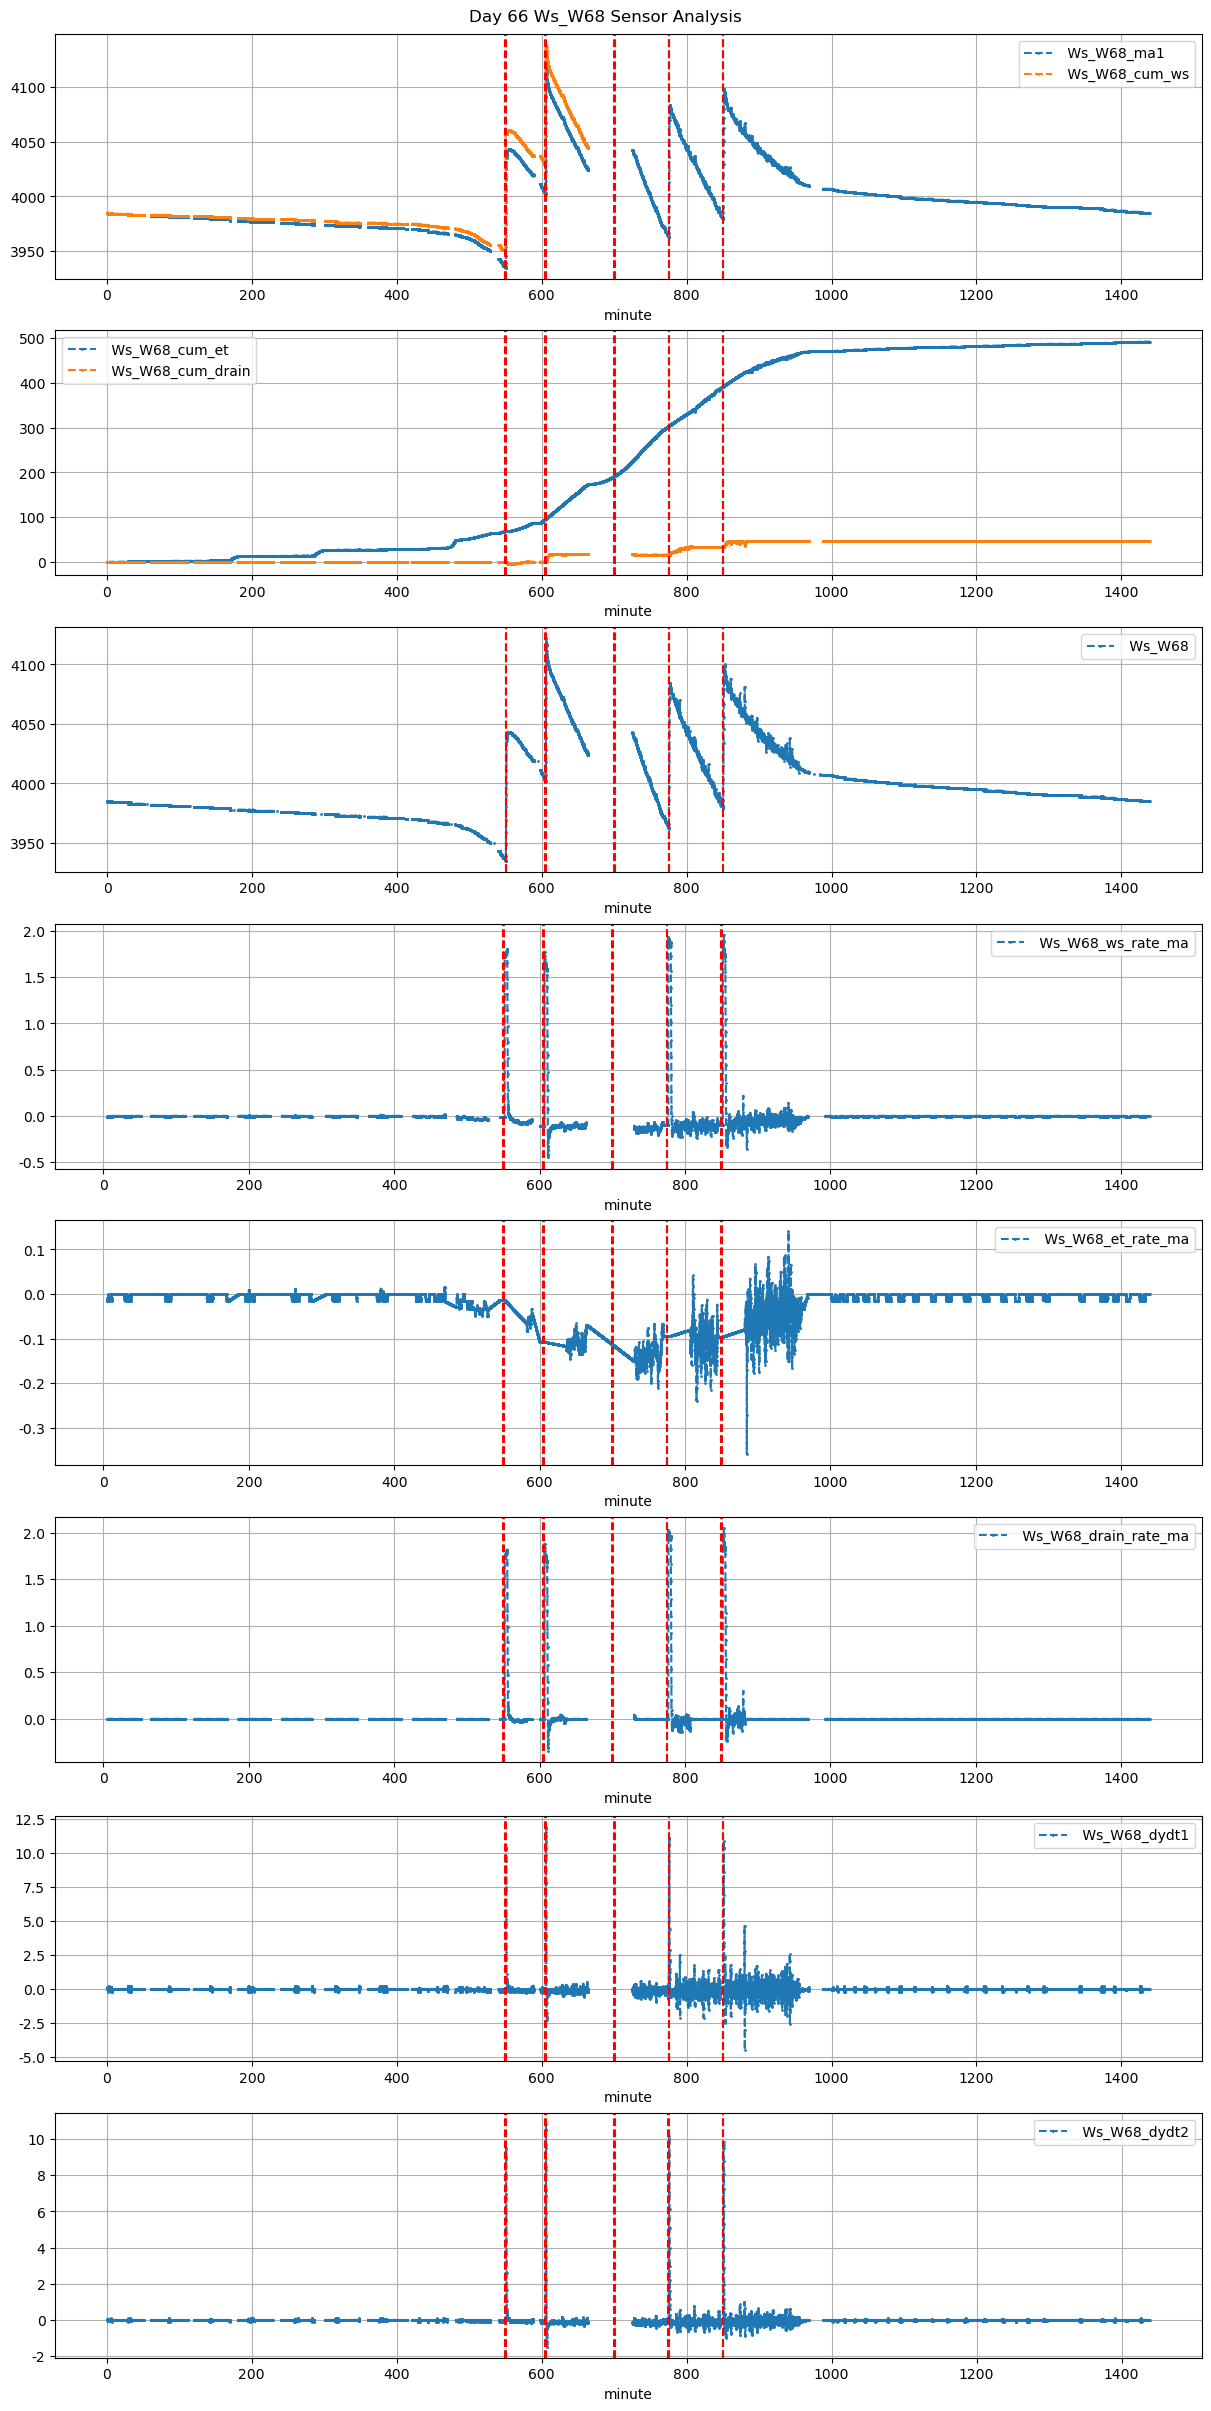
66 |
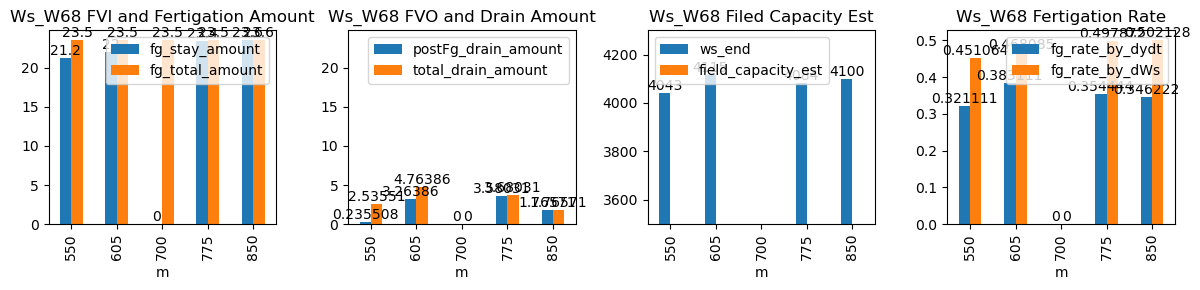
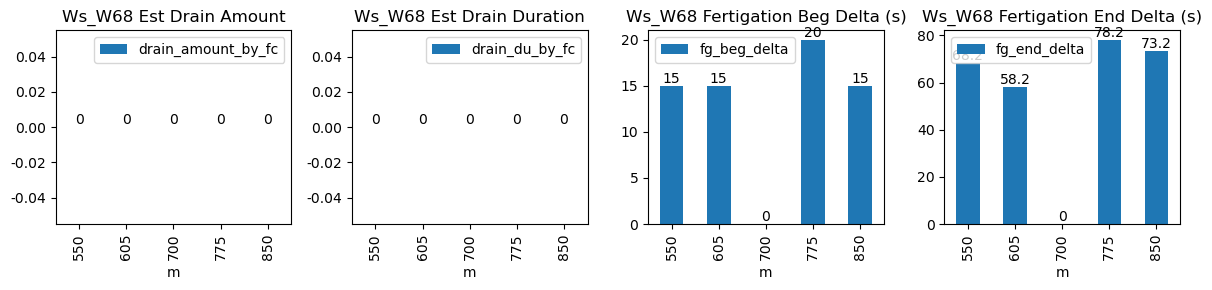
550 |
Ws_W68 |
0.455965 |
30 |
550.0 |
550.250000 |
550.78 |
551.916667 |
NaN |
NaN |
NaN |
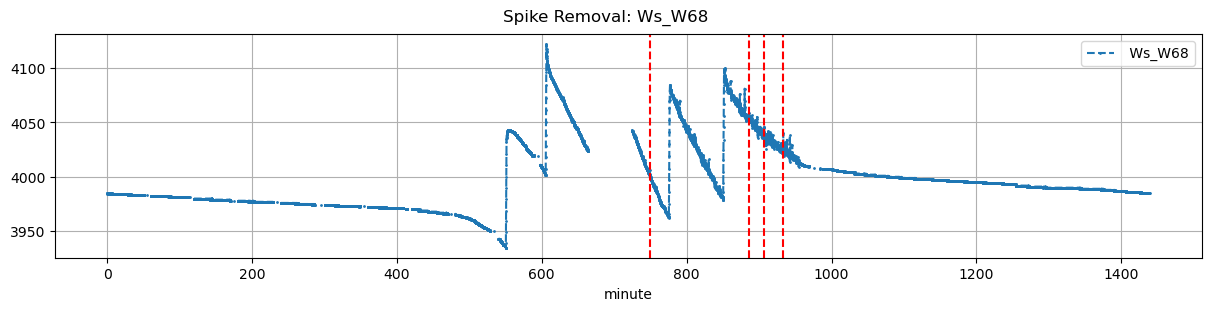
3937.0 |
4043.0 |
47 |
-0.074407 |
-0.013611 |
-0.066138 |
0.321111 |
0.451064 |
21.2 |
15.0 |
68.2 |
23.5 |
2.3 |
0.235508 |
NaN |
2.535508 |
| 2025-12-11 10:05:00+08:00 |
66 |
605 |
Ws_W68 |
0.455965 |
30 |
605.0 |
605.250000 |
605.78 |
606.750000 |
NaN |
NaN |
NaN |
4005.0 |
4115.0 |
47 |
-0.107284 |
-0.170278 |
-0.116725 |
0.383111 |
0.468085 |
22.0 |
15.0 |
58.2 |
23.5 |
1.5 |
3.263856 |
NaN |
4.763856 |
| 2025-12-11 11:40:00+08:00 |
66 |
700 |
Ws_W68 |
0.455965 |
30 |
700.0 |
NaN |
700.78 |
NaN |
NaN |
NaN |
NaN |
NaN |
NaN |
47 |
NaN |
NaN |
-0.151204 |
NaN |
NaN |
NaN |
NaN |
NaN |
23.5 |
NaN |
NaN |
NaN |
NaN |
| 2025-12-11 12:55:00+08:00 |
66 |
775 |
Ws_W68 |
0.455965 |
30 |
775.0 |
775.333333 |
775.78 |
777.083333 |
NaN |
NaN |
NaN |
3967.0 |
4084.0 |
47 |
-0.095145 |
-0.149444 |
-0.079931 |
0.354444 |
0.497872 |
23.4 |
20.0 |
78.2 |
23.5 |
0.1 |
3.580312 |
NaN |
3.680312 |
| 2025-12-11 14:10:00+08:00 |
66 |
850 |
Ws_W68 |
0.455965 |
30 |
850.0 |
850.250000 |
850.78 |
852.000000 |
NaN |
NaN |
NaN |
3982.0 |
4100.0 |
47 |
-0.095339 |
-0.148750 |
-0.078681 |
0.346222 |
0.502128 |
23.6 |
15.0 |
73.2 |
23.6 |
0.0 |
1.765706 |
NaN |
1.765706 |