| 2025-12-14 10:40:00+08:00 |
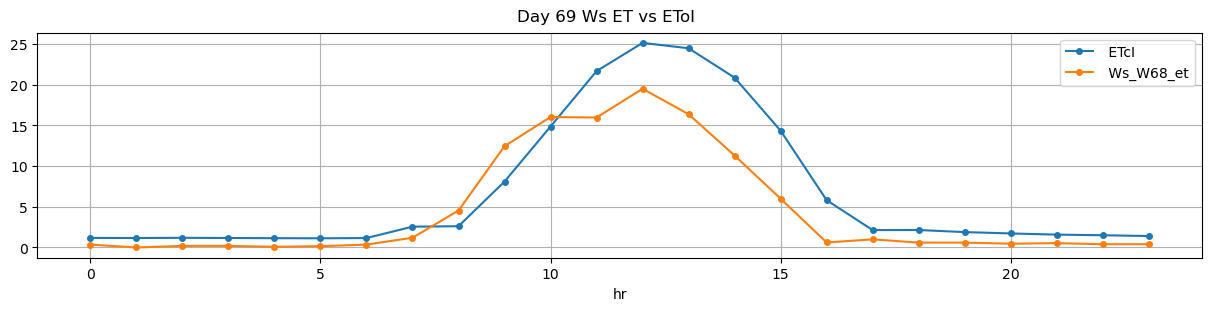
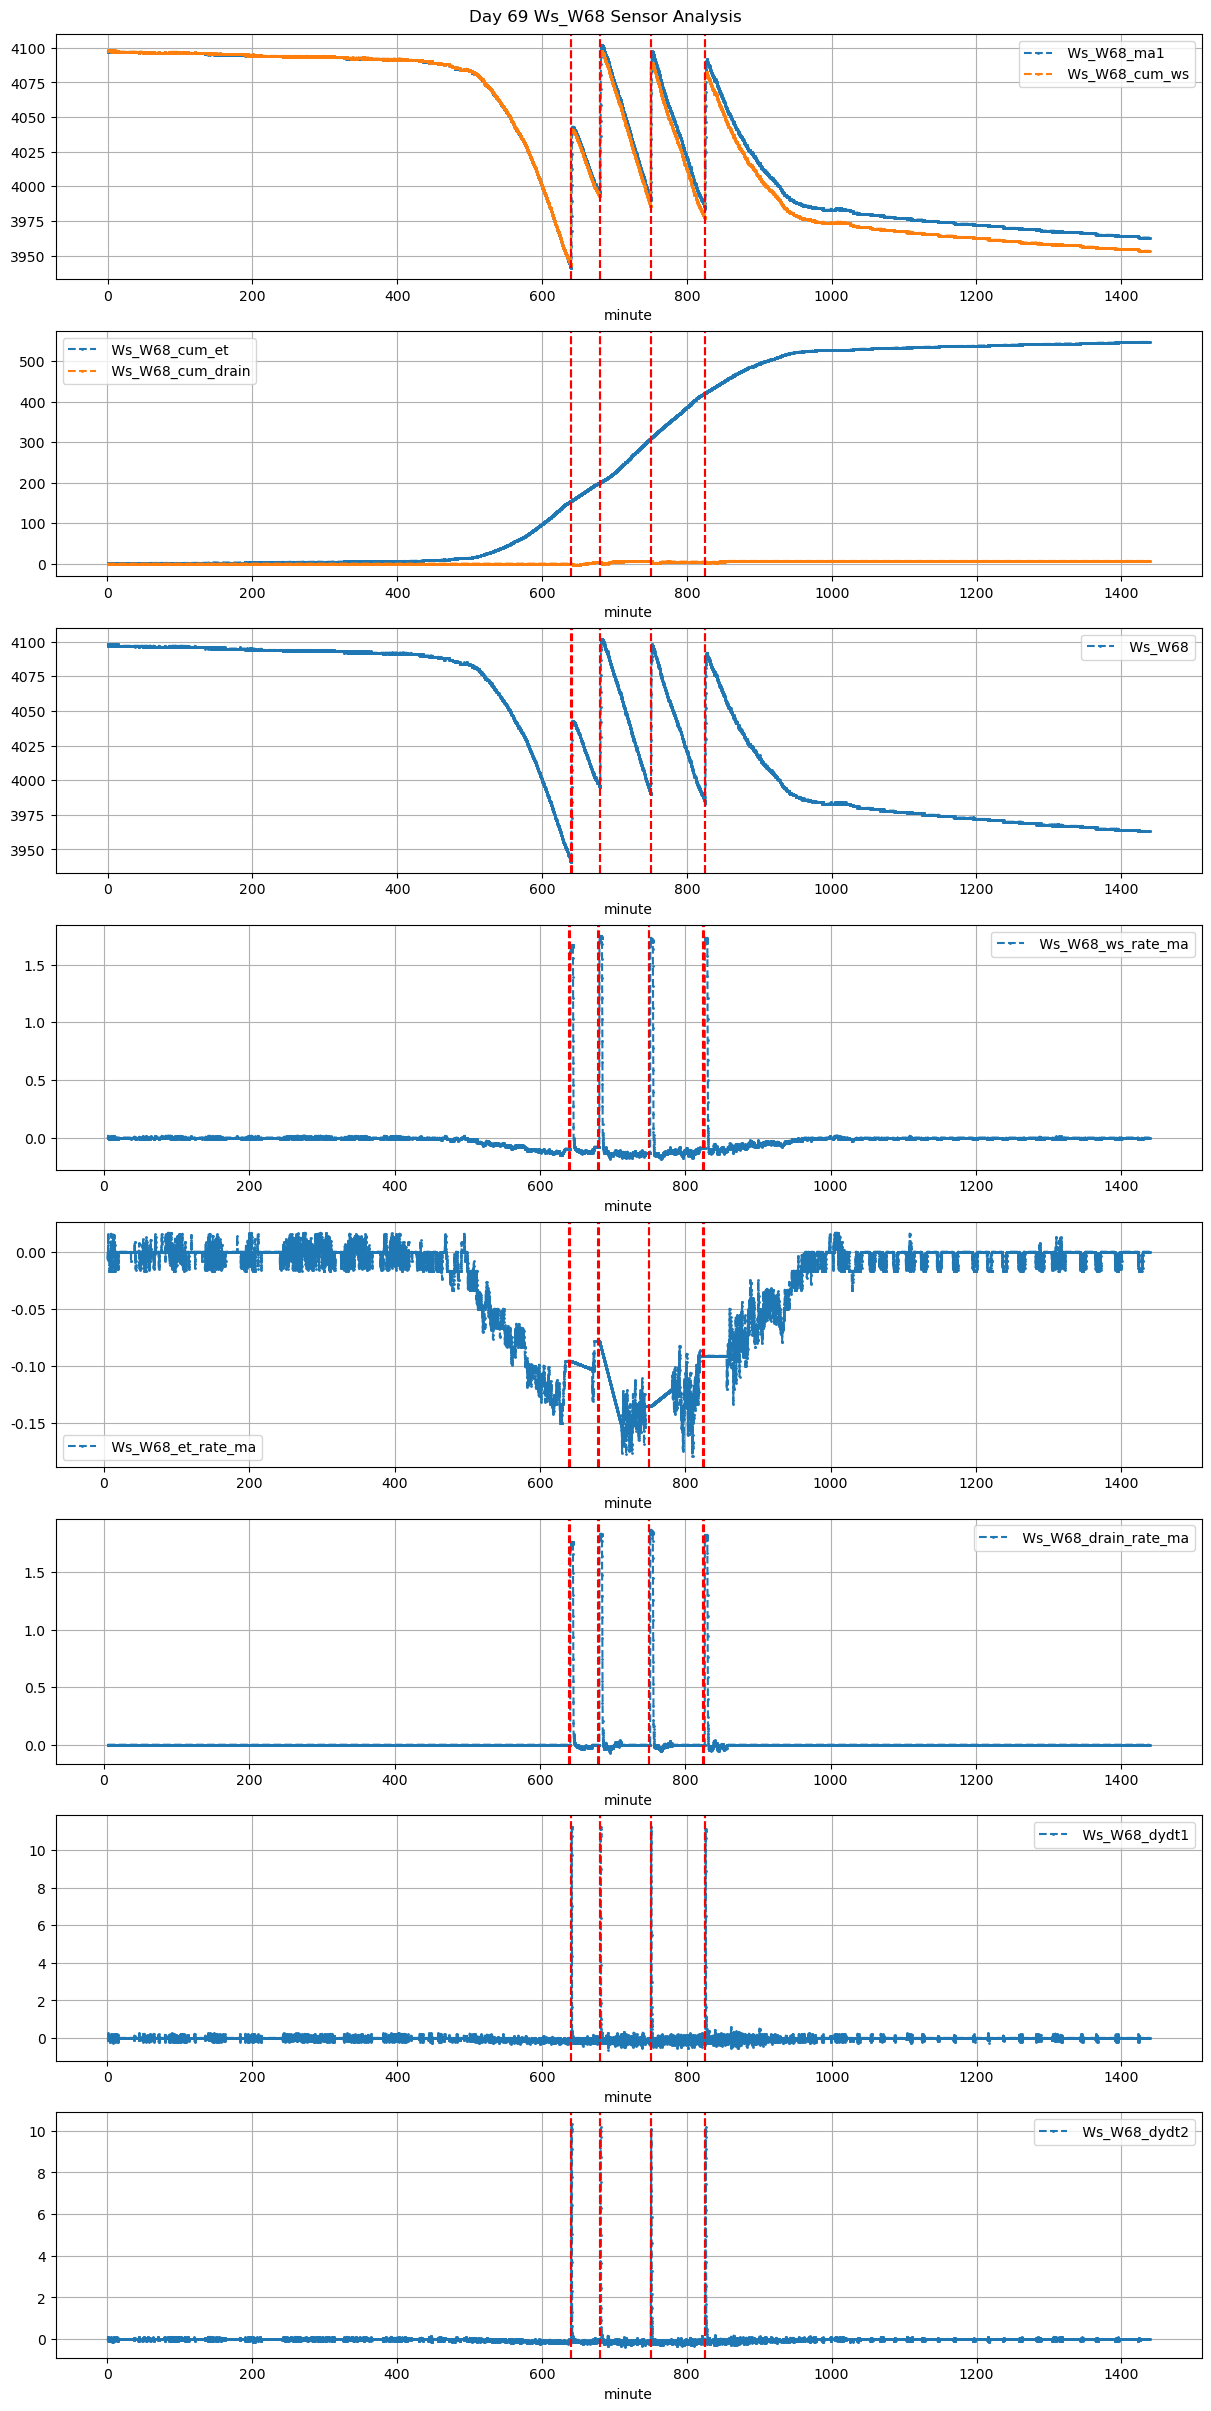
69 |
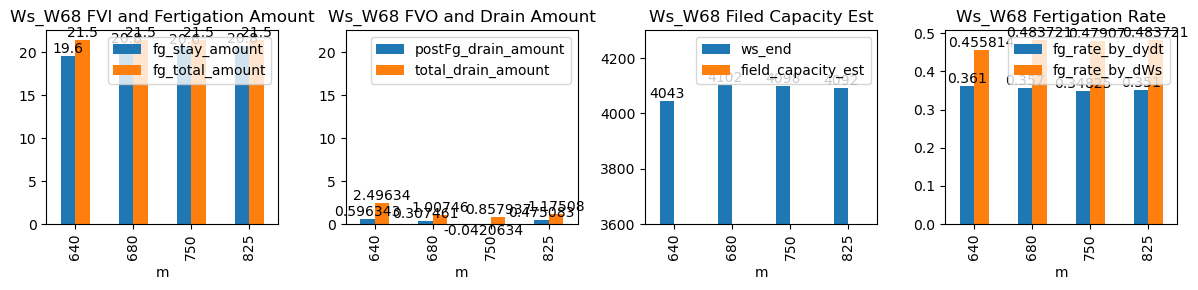
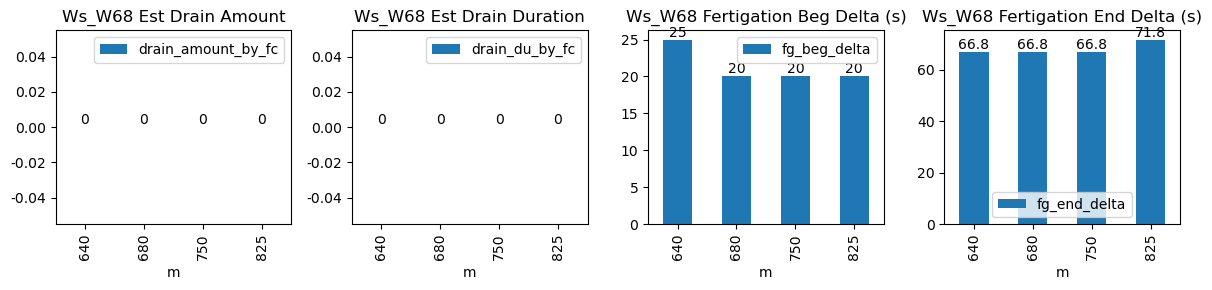
640 |
Ws_W68 |
0.302245 |
30 |
640.0 |
640.416667 |
640.72 |
641.833333 |
NaN |
NaN |
NaN |
3945.0 |
4043.0 |
43 |
-0.115113 |
-0.095694 |
-0.103175 |
0.36100 |
0.455814 |
19.6 |
25.0 |
66.8 |
21.5 |
1.9 |
0.596343 |
NaN |
2.496343 |
| 2025-12-14 11:20:00+08:00 |
69 |
680 |
Ws_W68 |
0.302245 |
30 |
680.0 |
680.333333 |
680.72 |
681.833333 |
NaN |
NaN |
NaN |
3998.0 |
4102.0 |
43 |
-0.078531 |
-0.114167 |
-0.152546 |
0.35700 |
0.483721 |
20.8 |
20.0 |
66.8 |
21.5 |
0.7 |
0.307461 |
NaN |
1.007461 |
| 2025-12-14 12:30:00+08:00 |
69 |
750 |
Ws_W68 |
0.302245 |
30 |
750.0 |
750.333333 |
750.72 |
751.833333 |
NaN |
NaN |
NaN |
3995.0 |
4098.0 |
43 |
-0.135858 |
-0.144306 |
-0.120590 |
0.34825 |
0.479070 |
20.6 |
20.0 |
66.8 |
21.5 |
0.9 |
-0.042063 |
NaN |
0.857937 |
| 2025-12-14 13:45:00+08:00 |
69 |
825 |
Ws_W68 |
0.302245 |
30 |
825.0 |
825.333333 |
825.72 |
826.916667 |
NaN |
NaN |
NaN |
3988.0 |
4092.0 |
43 |
-0.091263 |
-0.117778 |
-0.091500 |
0.35100 |
0.483721 |
20.8 |
20.0 |
71.8 |
21.5 |
0.7 |
0.475083 |
NaN |
1.175083 |