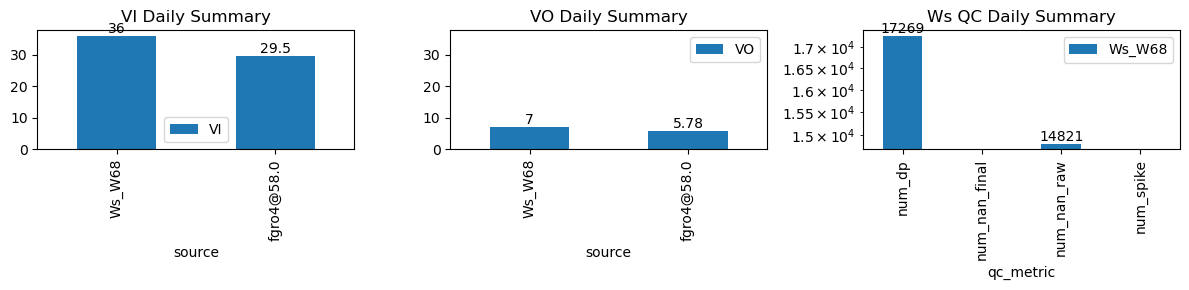
VI and VO Daily Summary
| ws_name | num_dp | num_nan_raw | num_nan_final | num_spike | cum_step_adj |
|---|---|---|---|---|---|
| Ws_W68 | 17,269 | 14,821 | 0 | 0 | 0.00 |
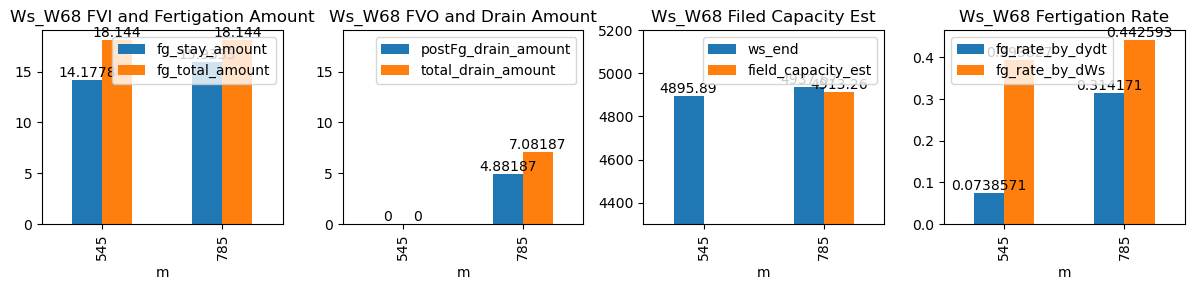
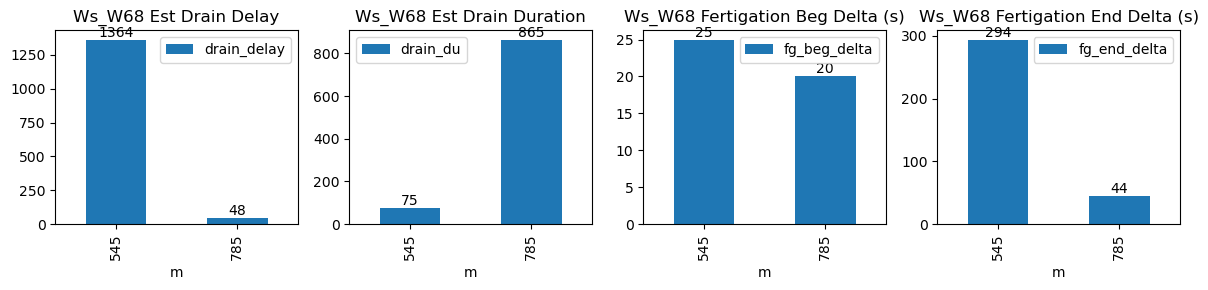
| ds | d | m | ws_name | prominence_cut | max_drain_du | fg_beg | fg_beg_est | fg_end | fg_end_est | ws_beg | ws_end | duc | pre_fg_et | post_fg_ws | post_drn_et | fg_rate_by_dydt | fg_rate_by_dWs | fg_stay_amount | enough_data | fg_beg_delta | fg_end_delta | fg_total_amount | fg_drain_amount | postFg_drain_amount | total_drain_amount | drain_du | drain_delay | drain_rate | field_capacity_est |
|---|---|---|---|---|---|---|---|---|---|---|---|---|---|---|---|---|---|---|---|---|---|---|---|---|---|---|---|---|---|
| 2026-01-01 09:05:00+08:00 | 87 | 545 | Ws_W68 | 0.327345 | 30 | 545.0 | 545.416667 | 545.6 | 550.500000 | 4825.0 | 4895.888889 | 36 | -0.003496 | -0.002673 | -0.006365 | 0.073857 | 0.393827 | 14.177778 | True | 25.0 | 294.0 | 18.144 | 0.0 | 0.000000 | 0.000000 | 75 | 1364 | -0.011729 | NaN |
| 2026-01-01 13:05:00+08:00 | 87 | 785 | Ws_W68 | 0.327345 | 30 | 785.0 | 785.333333 | 785.6 | 786.333333 | 4858.0 | 4937.666667 | 36 | -0.009582 | -0.085988 | -0.019074 | 0.314171 | 0.442593 | 15.933333 | True | 20.0 | 44.0 | 18.144 | 2.2 | 4.881875 | 7.081875 | 865 | 48 | -0.112604 | 4913.257292 |