| 2025-12-31 09:00:00+08:00 |
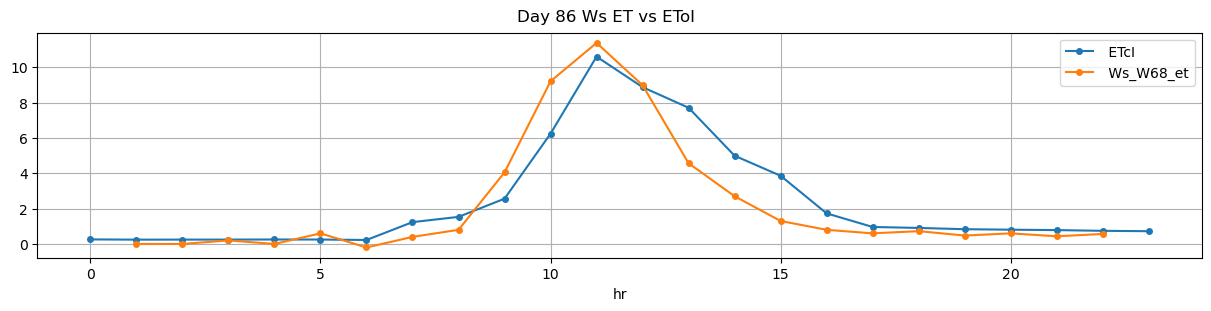
86 |
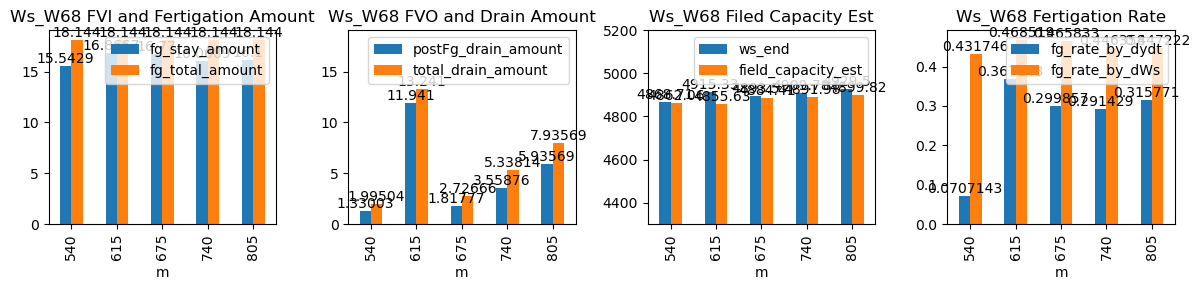
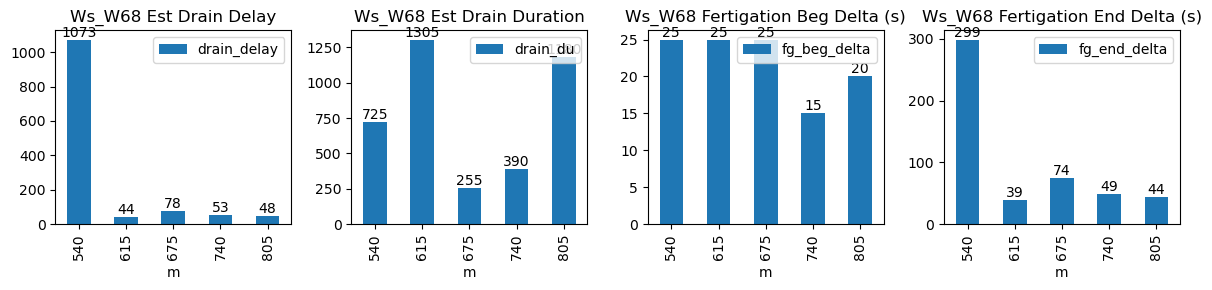
540 |
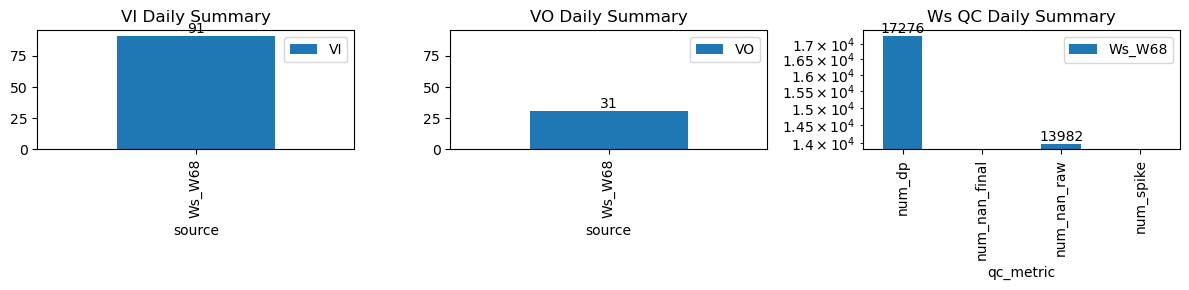
Ws_W68 |
0.434048 |
30 |
540.0 |
540.416667 |
540.6 |
545.583333 |
4791.000000 |
4868.714286 |
36 |
-0.002247 |
-0.016451 |
-0.031605 |
0.070714 |
0.431746 |
15.542857 |
True |
25.0 |
299.0 |
18.144 |
0.665015 |
1.330030 |
1.995045 |
725 |
1073 |
-0.064958 |
4862.064136 |
| 2025-12-31 10:15:00+08:00 |
86 |
615 |
Ws_W68 |
0.434048 |
30 |
615.0 |
615.416667 |
615.6 |
616.250000 |
4831.000000 |
4915.333333 |
36 |
-0.064928 |
-0.195844 |
-0.034455 |
0.367143 |
0.468519 |
16.866667 |
True |
25.0 |
39.0 |
18.144 |
1.300000 |
11.941014 |
13.241014 |
1305 |
44 |
-0.179982 |
4855.628264 |
| 2025-12-31 11:15:00+08:00 |
86 |
675 |
Ws_W68 |
0.434048 |
30 |
675.0 |
675.416667 |
675.6 |
676.833333 |
4809.650000 |
4893.500000 |
36 |
-0.066882 |
-0.090185 |
-0.092926 |
0.299857 |
0.465833 |
16.770000 |
True |
25.0 |
74.0 |
18.144 |
0.908885 |
1.817770 |
2.726655 |
255 |
78 |
-0.050162 |
4884.411150 |
| 2025-12-31 12:20:00+08:00 |
86 |
740 |
Ws_W68 |
0.434048 |
30 |
740.0 |
740.250000 |
740.6 |
741.416667 |
4829.433333 |
4909.777778 |
36 |
-0.065655 |
-0.114247 |
-0.064708 |
0.291429 |
0.446358 |
16.068889 |
True |
15.0 |
49.0 |
18.144 |
1.779378 |
3.558757 |
5.338135 |
390 |
53 |
-0.092719 |
4891.983993 |
| 2025-12-31 13:25:00+08:00 |
86 |
805 |
Ws_W68 |
0.434048 |
30 |
805.0 |
805.333333 |
805.6 |
806.333333 |
4849.000000 |
4929.500000 |
36 |
-0.031107 |
-0.113647 |
-0.029753 |
0.315771 |
0.447222 |
16.100000 |
True |
20.0 |
44.0 |
18.144 |
2.000000 |
5.935691 |
7.935691 |
1180 |
48 |
-0.154232 |
4899.821543 |