| 2026-01-02 10:25:00+08:00 |
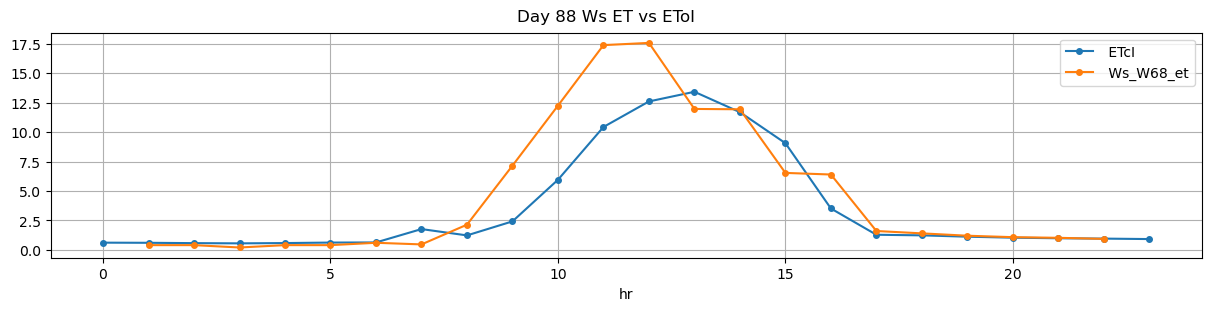
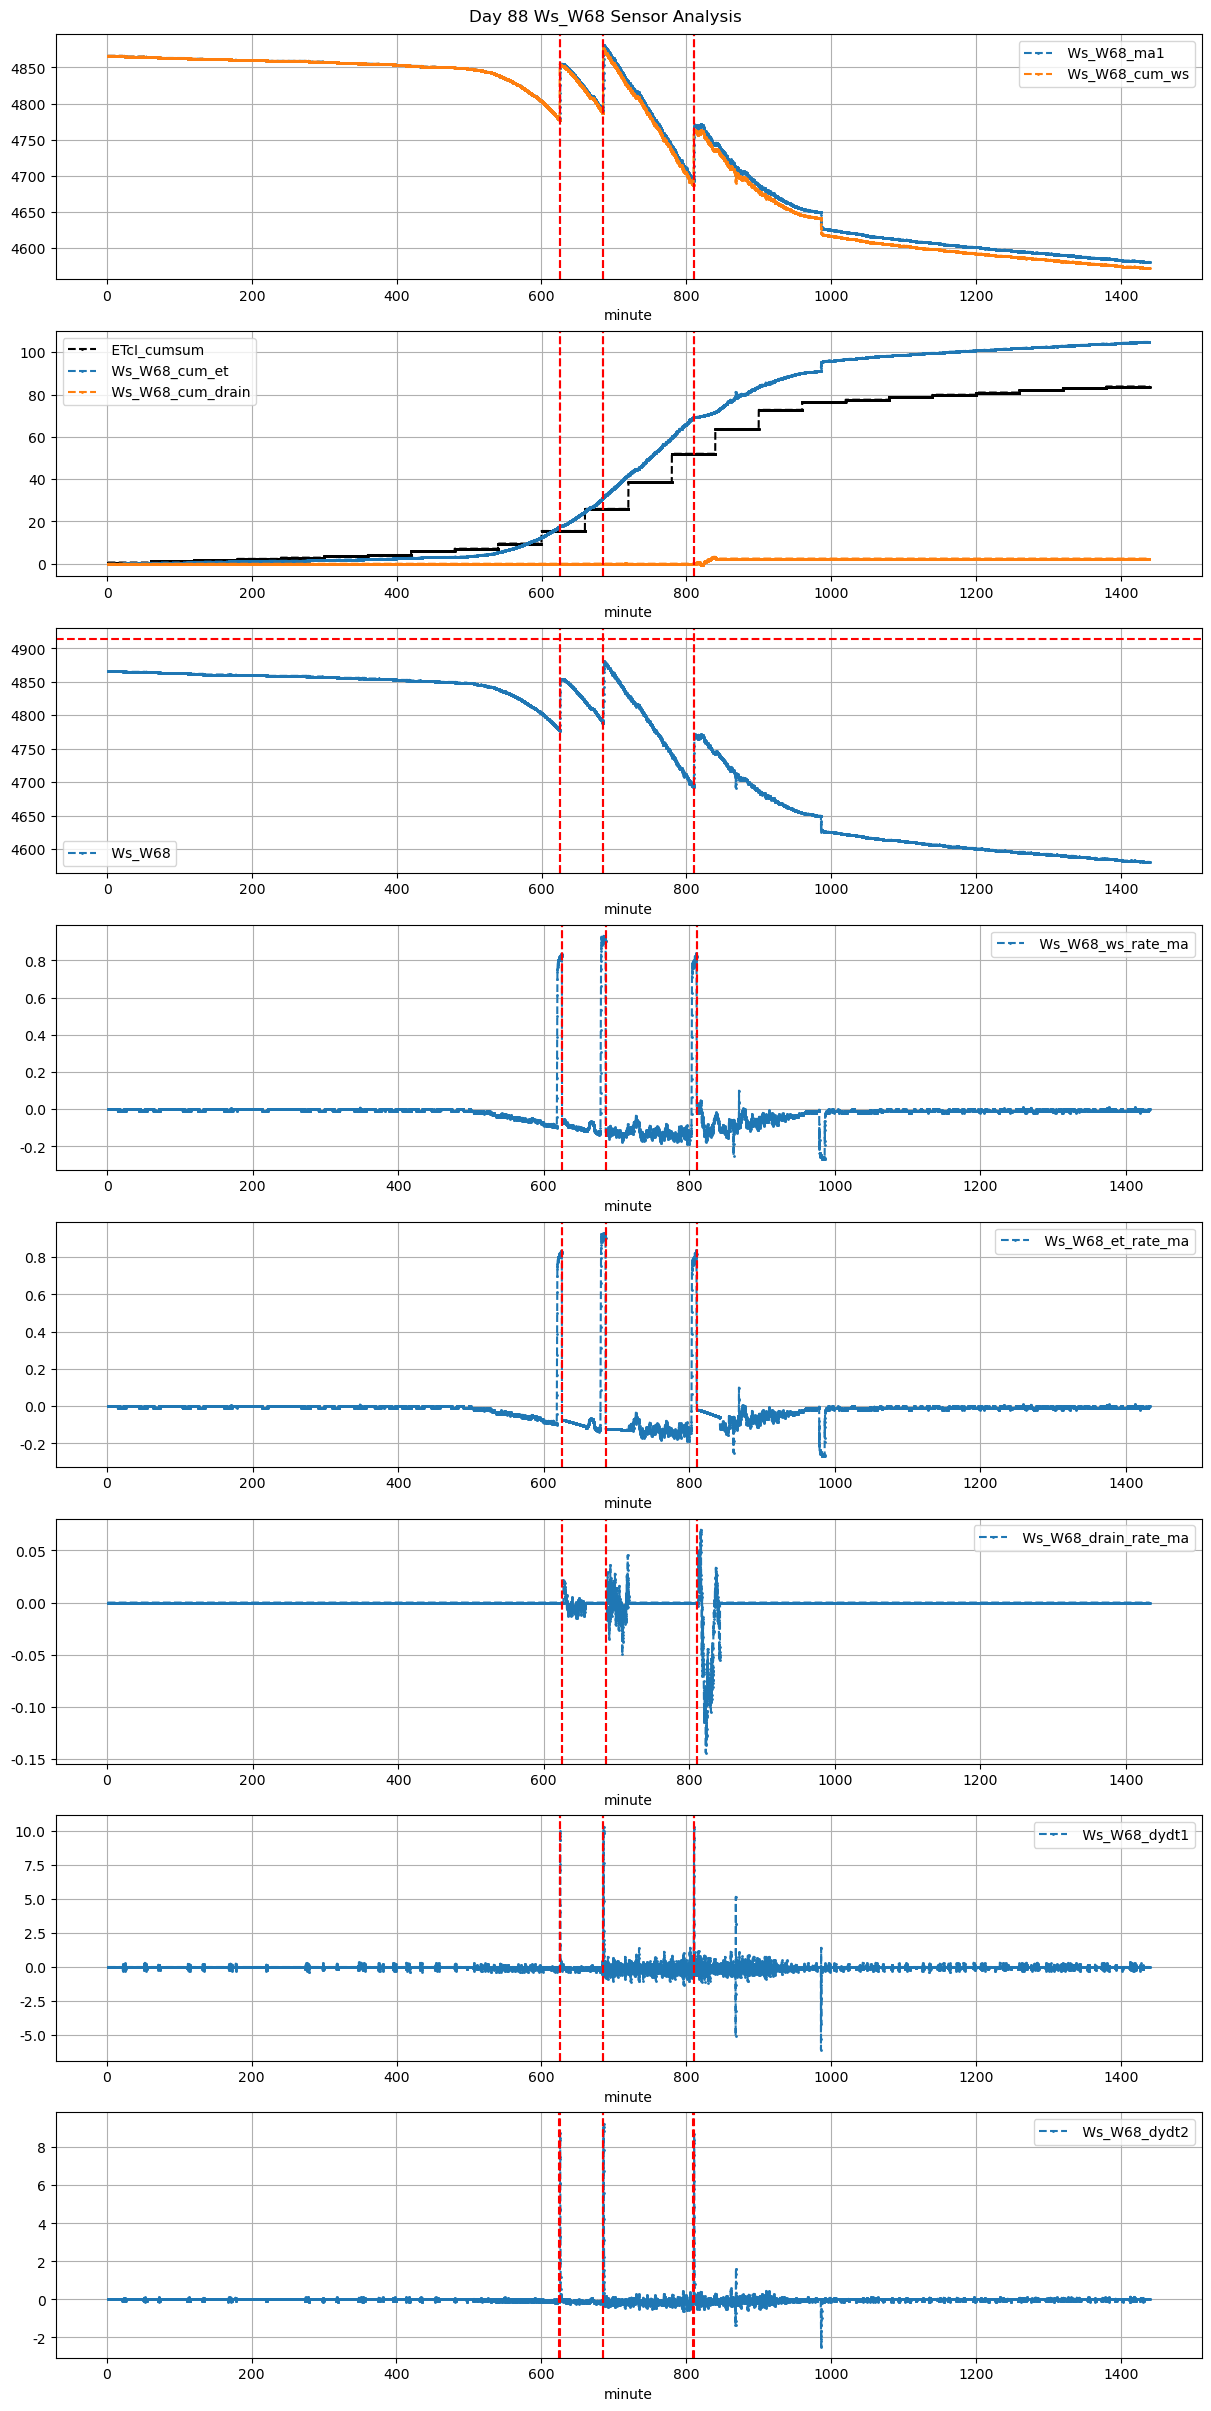
88 |
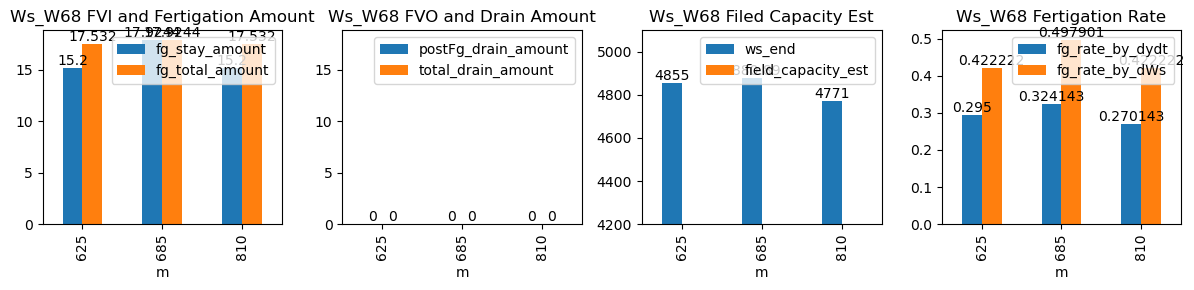
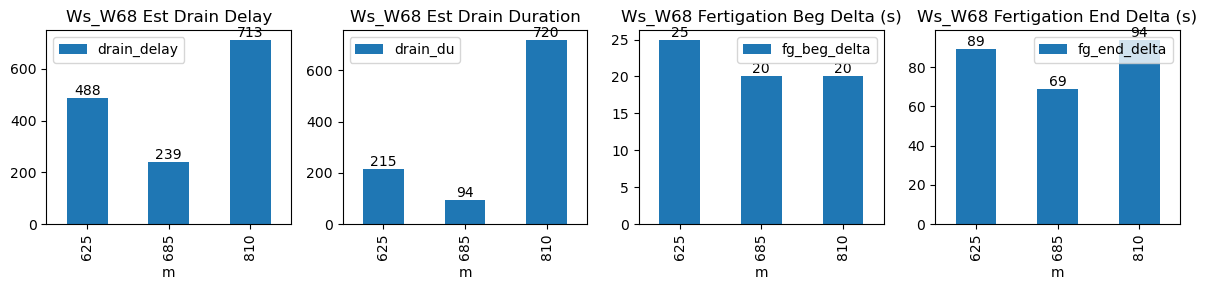
625 |
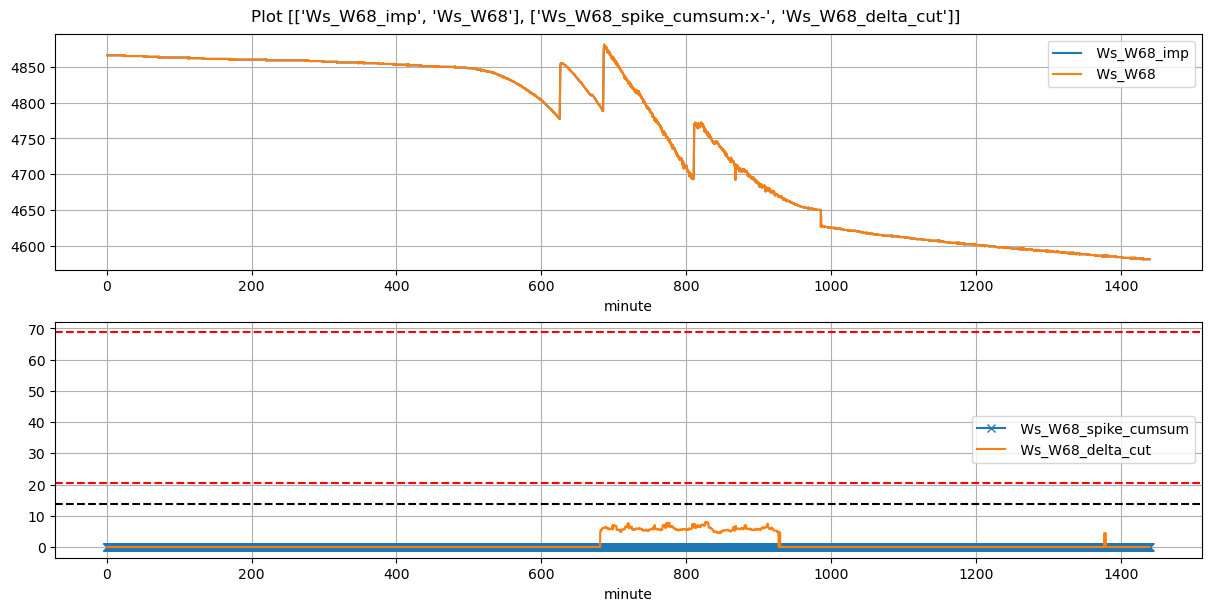
Ws_W68 |
0.445717 |
30 |
625.0 |
625.416667 |
625.6 |
627.083333 |
4779.000000 |
4855.000000 |
36 |
-0.089782 |
-0.073815 |
-0.107173 |
0.295000 |
0.422222 |
15.200000 |
True |
25.0 |
89.0 |
17.532000 |
0.0 |
0.0 |
0.0 |
215 |
488 |
-0.012159 |
NaN |
| 2026-01-02 11:25:00+08:00 |
88 |
685 |
Ws_W68 |
0.445717 |
30 |
685.0 |
685.333333 |
685.6 |
686.750000 |
4791.266667 |
4880.888889 |
36 |
-0.124672 |
-0.124352 |
-0.126072 |
0.324143 |
0.497901 |
17.924444 |
True |
20.0 |
69.0 |
17.924444 |
0.0 |
0.0 |
0.0 |
94 |
239 |
-0.026493 |
NaN |
| 2026-01-02 13:30:00+08:00 |
88 |
810 |
Ws_W68 |
0.445717 |
30 |
810.0 |
810.333333 |
810.6 |
812.166667 |
4695.000000 |
4771.000000 |
36 |
-0.134134 |
-0.018484 |
-0.058519 |
0.270143 |
0.422222 |
15.200000 |
True |
20.0 |
94.0 |
17.532000 |
0.0 |
0.0 |
0.0 |
720 |
713 |
-0.123129 |
NaN |