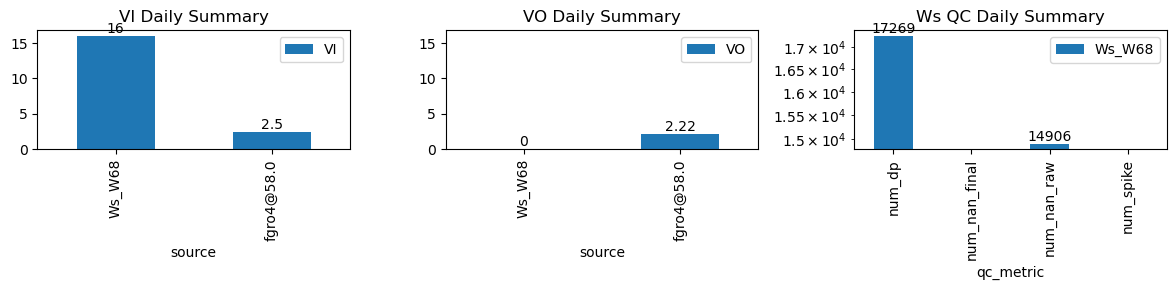
VI and VO Daily Summary
| ws_name | num_dp | num_nan_raw | num_nan_final | num_spike | cum_step_adj |
|---|---|---|---|---|---|
| Ws_W68 | 17,269 | 14,906 | 0 | 0 | 0.00 |
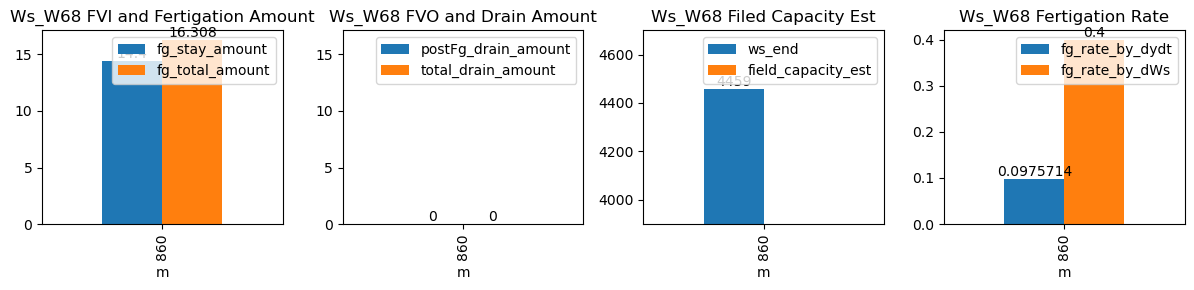
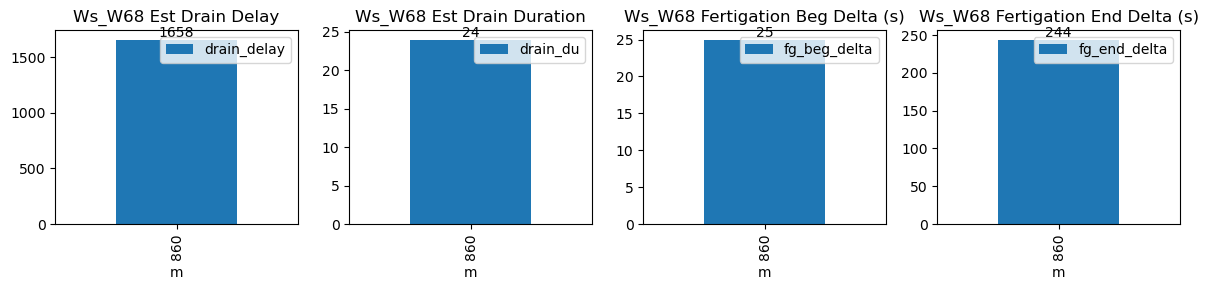
| ds | d | m | ws_name | prominence_cut | max_drain_du | fg_beg | fg_beg_est | fg_end | fg_end_est | ws_beg | ws_end | duc | pre_fg_et | post_fg_ws | post_drn_et | fg_rate_by_dydt | fg_rate_by_dWs | fg_stay_amount | enough_data | fg_beg_delta | fg_end_delta | fg_total_amount | fg_drain_amount | postFg_drain_amount | total_drain_amount | drain_du | drain_delay | drain_rate | field_capacity_est |
|---|---|---|---|---|---|---|---|---|---|---|---|---|---|---|---|---|---|---|---|---|---|---|---|---|---|---|---|---|---|
| 2026-01-04 14:20:00+08:00 | 90 | 860 | Ws_W68 | 0.126053 | 30 | 860.0 | 860.416667 | 860.6 | 864.666667 | 4387.0 | 4459.0 | 36 | -0.00205 | 0.0 | -0.013889 | 0.097571 | 0.4 | 14.4 | True | 25.0 | 244.0 | 16.308 | 0.0 | 0 | 0.0 | 24 | 1658 | -0.007945 | NaN |