| 2026-01-05 11:10:00+08:00 |
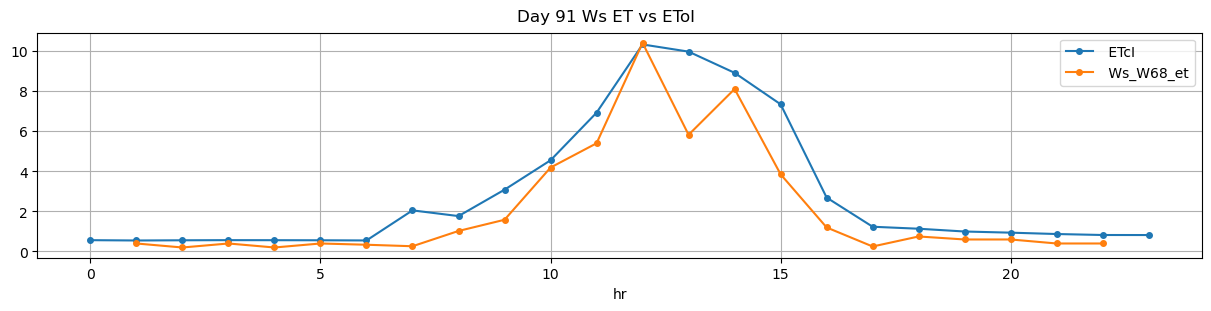
91 |
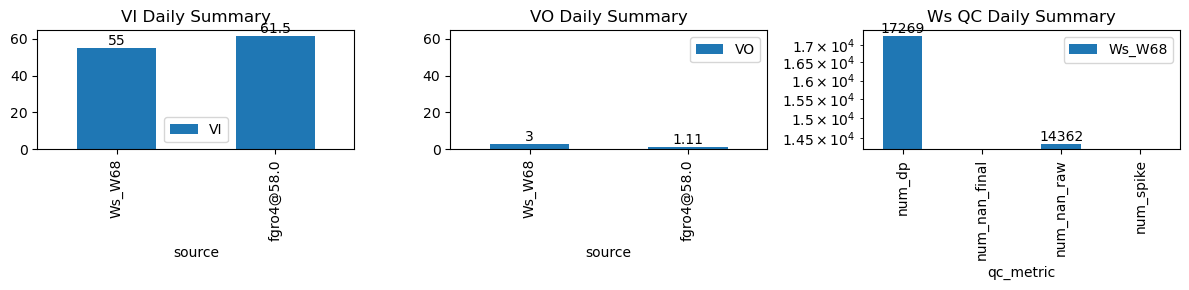
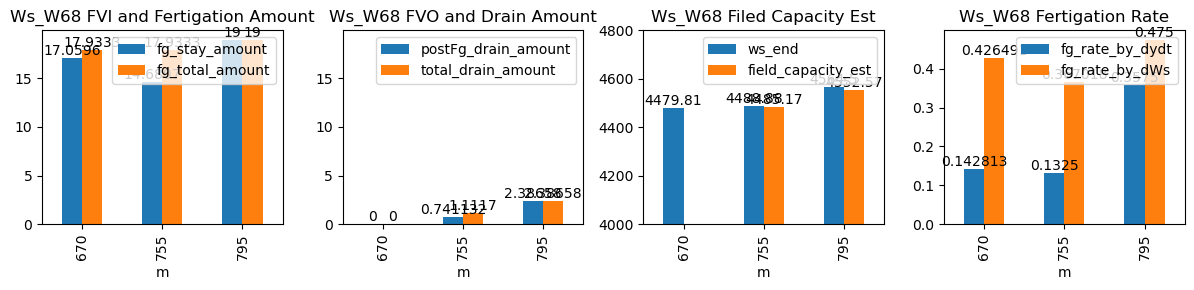
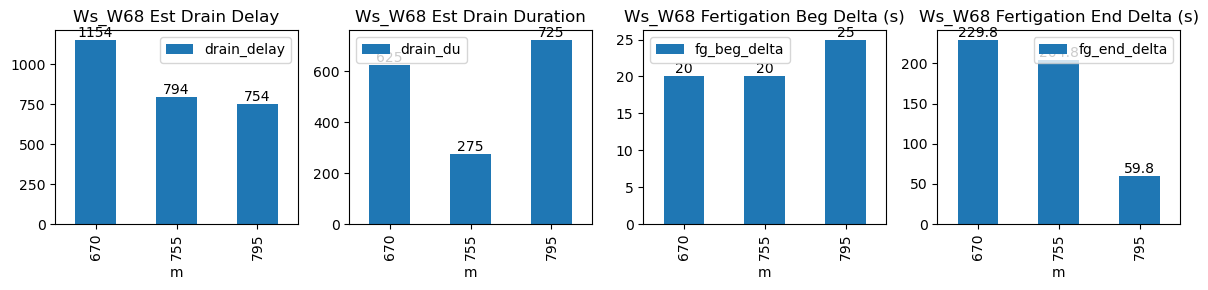
670 |
Ws_W68 |
0.271099 |
30 |
670.0 |
670.333333 |
670.67 |
674.500000 |
4394.514286 |
4479.8125 |
40 |
-0.044958 |
-0.014475 |
-0.055741 |
0.142813 |
0.426491 |
17.059643 |
True |
20.0 |
229.8 |
17.933333 |
0.000000 |
0.000000 |
0.000000 |
625 |
1154 |
-0.014601 |
NaN |
| 2026-01-05 12:35:00+08:00 |
91 |
755 |
Ws_W68 |
0.271099 |
30 |
755.0 |
755.333333 |
755.67 |
759.083333 |
4415.471429 |
4488.8750 |
40 |
-0.138868 |
-0.036988 |
0.000000 |
0.132500 |
0.367018 |
14.680714 |
True |
20.0 |
204.8 |
17.933333 |
0.370566 |
0.741132 |
1.111698 |
275 |
794 |
-0.068070 |
4485.169340 |
| 2026-01-05 13:15:00+08:00 |
91 |
795 |
Ws_W68 |
0.271099 |
30 |
795.0 |
795.416667 |
795.67 |
796.666667 |
4469.500000 |
4564.5000 |
40 |
-0.050631 |
-0.069193 |
-0.036389 |
0.357500 |
0.475000 |
19.000000 |
True |
25.0 |
59.8 |
19.000000 |
0.000000 |
2.386575 |
2.386575 |
725 |
754 |
-0.077413 |
4552.567125 |