| 2026-03-23 07:52:29+08:00 |
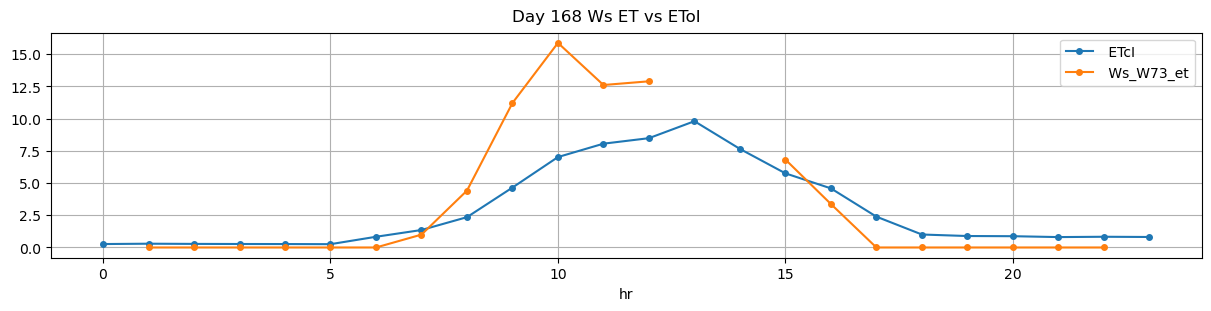
168 |
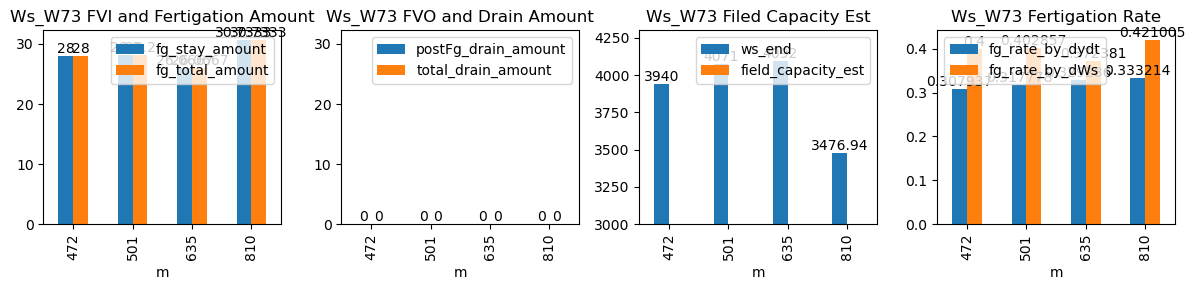
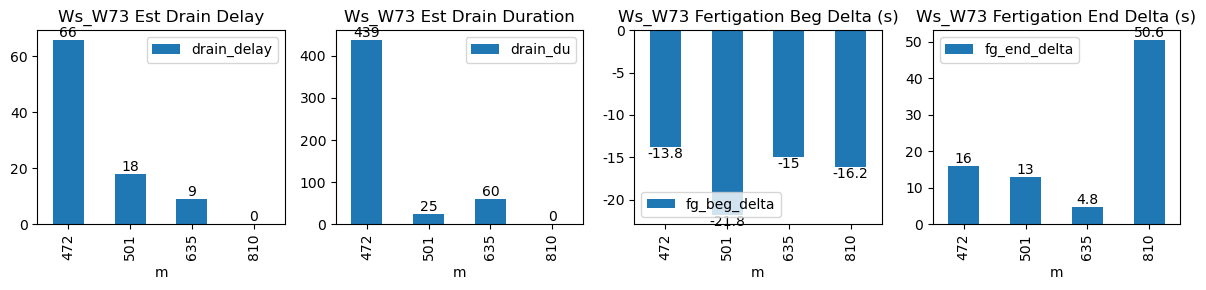
472 |
Ws_W73 |
5.915324 |
27.083333 |
472.48 |
472.250000 |
473.65 |
473.916667 |
3800.000000 |
3940.000000 |
70 |
0.000000 |
-0.104630 |
0.000000 |
0.307937 |
0.400000 |
28.000000 |
True |
-13.8 |
16.0 |
28.000000 |
0.0 |
0.0 |
0.0 |
439.0 |
66.0 |
-0.111111 |
NaN |
| 2026-03-23 08:21:32+08:00 |
168 |
501 |
Ws_W73 |
5.915324 |
30.000000 |
501.53 |
501.166667 |
502.70 |
502.916667 |
3930.000000 |
4071.000000 |
70 |
-0.016347 |
-0.008128 |
-0.022809 |
0.317778 |
0.402857 |
28.200000 |
True |
-21.8 |
13.0 |
28.200000 |
0.0 |
0.0 |
0.0 |
25.0 |
18.0 |
-0.098834 |
NaN |
| 2026-03-23 10:35:00+08:00 |
168 |
635 |
Ws_W73 |
5.915324 |
30.000000 |
635.00 |
634.750000 |
636.17 |
636.250000 |
3961.666667 |
4092.000000 |
70 |
-0.068611 |
-0.102469 |
-0.110642 |
0.329286 |
0.372381 |
26.066667 |
True |
-15.0 |
4.8 |
26.066667 |
0.0 |
0.0 |
0.0 |
60.0 |
9.0 |
-0.120664 |
NaN |
| 2026-03-23 13:30:01+08:00 |
168 |
810 |
Ws_W73 |
5.915324 |
30.000000 |
810.02 |
809.750000 |
811.24 |
812.083333 |
3323.273810 |
3476.940476 |
73 |
-0.643990 |
NaN |
-0.030556 |
0.333214 |
0.421005 |
30.733333 |
True |
-16.2 |
50.6 |
30.733333 |
0.0 |
0.0 |
0.0 |
NaN |
NaN |
NaN |
NaN |