| 2026-03-22 08:05:00+08:00 |
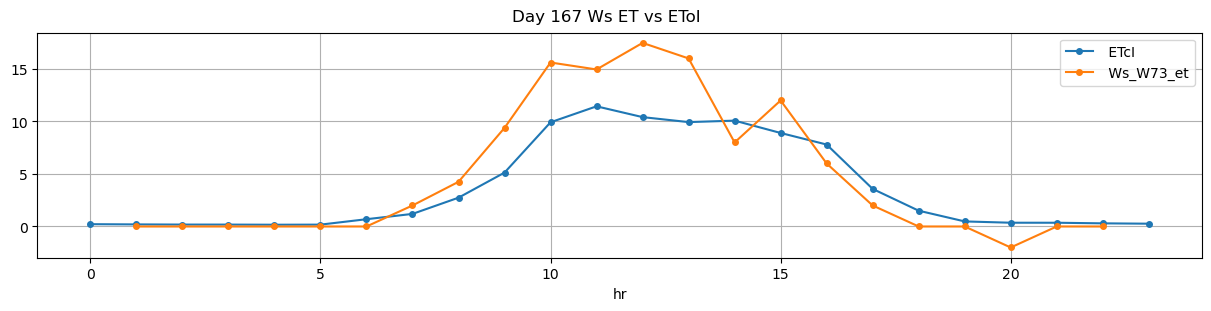
167 |
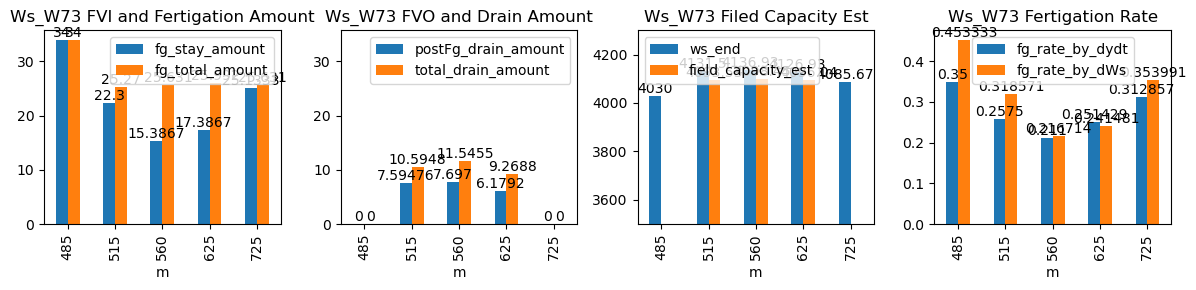
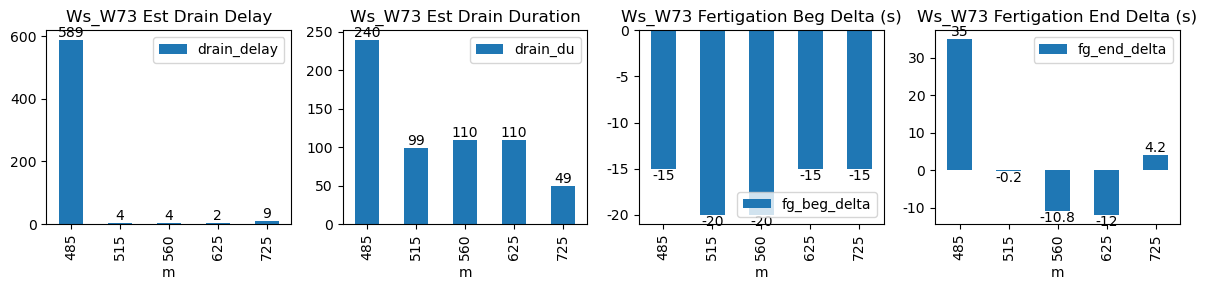
485 |
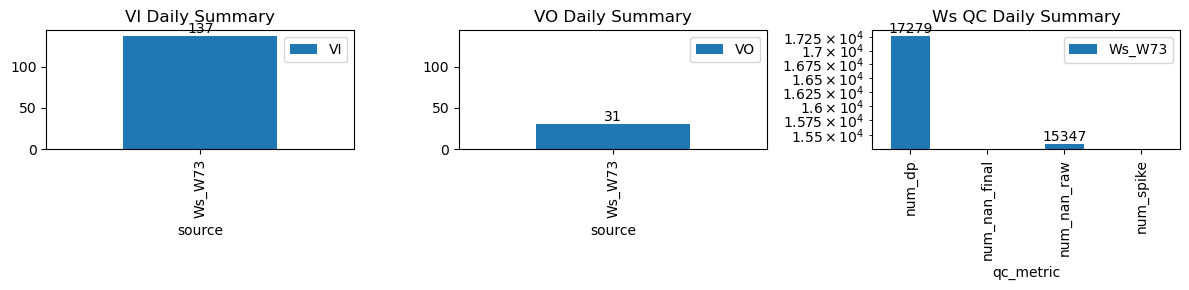
Ws_W73 |
0.809265 |
28.166667 |
485.0 |
484.750000 |
486.25 |
486.833333 |
3860.0 |
4030.000000 |
75 |
0.000000 |
-0.014444 |
0.000000 |
0.350000 |
0.453333 |
34.000000 |
True |
-15.0 |
35.0 |
34.000 |
0.000000 |
0.000000 |
0.000000 |
240 |
589 |
-0.098609 |
NaN |
| 2026-03-22 08:35:00+08:00 |
167 |
515 |
Ws_W73 |
0.809265 |
30.000000 |
515.0 |
514.666667 |
516.17 |
516.166667 |
4020.0 |
4131.500000 |
70 |
-0.035629 |
-0.051543 |
-0.079218 |
0.257500 |
0.318571 |
22.300000 |
True |
-20.0 |
-0.2 |
25.270 |
3.000000 |
7.594763 |
10.594763 |
99 |
4 |
-0.094647 |
4093.526184 |
| 2026-03-22 09:20:00+08:00 |
167 |
560 |
Ws_W73 |
0.809265 |
30.000000 |
560.0 |
559.666667 |
561.18 |
561.000000 |
4060.0 |
4136.933333 |
71 |
-0.059925 |
-0.081152 |
-0.064352 |
0.211000 |
0.216714 |
15.386667 |
True |
-20.0 |
-10.8 |
25.631 |
3.848500 |
7.696999 |
11.545499 |
110 |
4 |
-0.050101 |
4098.448338 |
| 2026-03-22 10:25:00+08:00 |
167 |
625 |
Ws_W73 |
0.809265 |
30.000000 |
625.0 |
624.750000 |
626.20 |
626.000000 |
4040.0 |
4126.933333 |
72 |
-0.106409 |
-0.137016 |
-0.097222 |
0.251429 |
0.241481 |
17.386667 |
True |
-15.0 |
-12.0 |
25.992 |
3.089601 |
6.179201 |
9.268802 |
110 |
2 |
-0.097170 |
4096.037326 |
| 2026-03-22 12:05:00+08:00 |
167 |
725 |
Ws_W73 |
0.809265 |
30.000000 |
725.0 |
724.750000 |
726.18 |
726.250000 |
3960.0 |
4085.666667 |
71 |
-0.145755 |
-0.108642 |
-0.114403 |
0.312857 |
0.353991 |
25.133333 |
True |
-15.0 |
4.2 |
25.631 |
0.000000 |
0.000000 |
0.000000 |
49 |
9 |
-0.080282 |
NaN |