| 2026-04-06 08:21:41+08:00 |
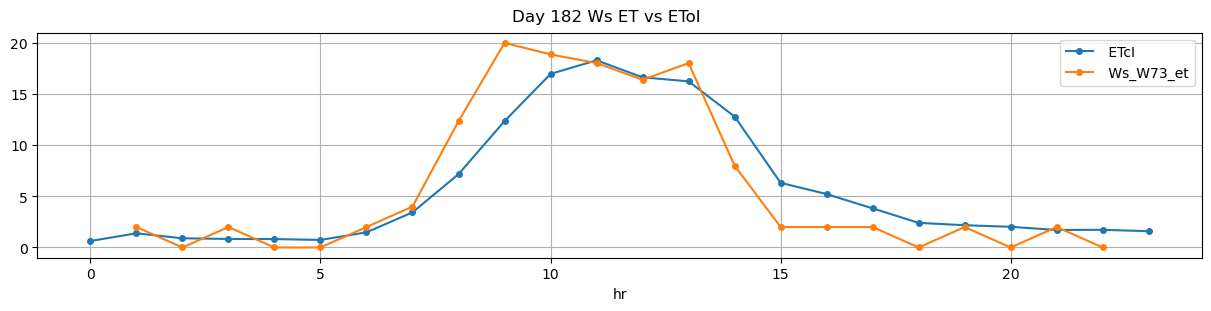
182 |
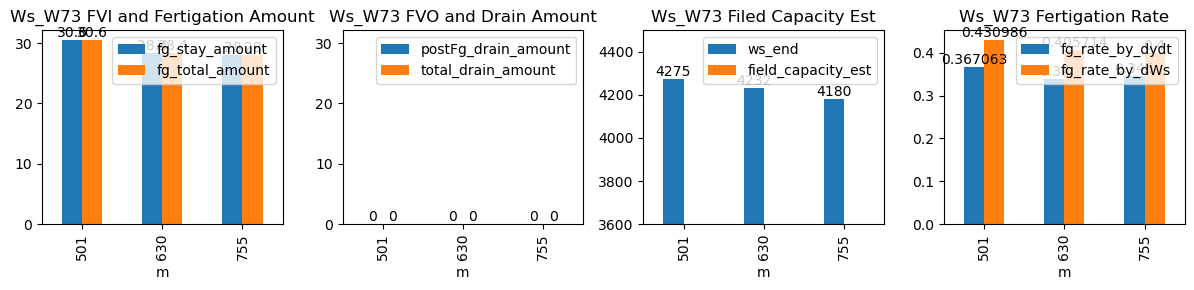
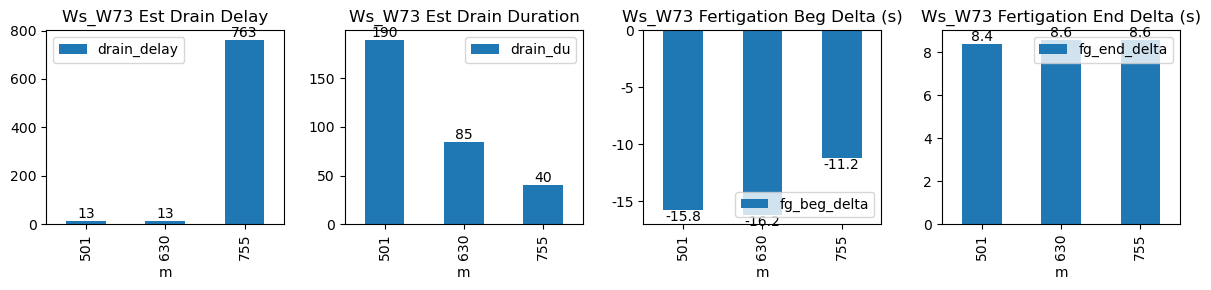
501 |
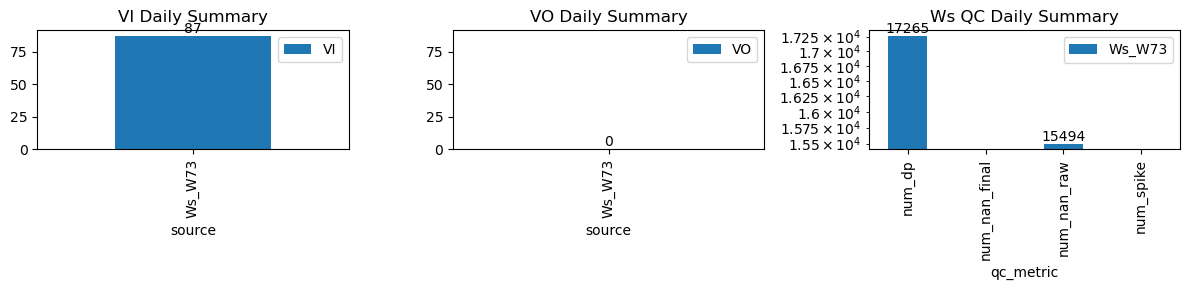
Ws_W73 |
1.134859 |
30 |
501.68 |
501.416667 |
502.86 |
503.000000 |
4122.0 |
4275.0 |
71 |
-0.088154 |
-0.081481 |
-0.079630 |
0.367063 |
0.430986 |
30.6 |
True |
-15.8 |
8.4 |
30.6 |
0.0 |
0 |
0.0 |
190 |
13 |
-0.031416 |
NaN |
| 2026-04-06 10:30:01+08:00 |
182 |
630 |
Ws_W73 |
1.134859 |
30 |
630.02 |
629.750000 |
631.19 |
631.333333 |
4090.0 |
4232.0 |
70 |
-0.120162 |
-0.153086 |
-0.132099 |
0.340000 |
0.405714 |
28.4 |
True |
-16.2 |
8.6 |
28.4 |
0.0 |
0 |
0.0 |
85 |
13 |
-0.101831 |
NaN |
| 2026-04-06 12:35:01+08:00 |
182 |
755 |
Ws_W73 |
1.134859 |
30 |
755.02 |
754.833333 |
756.19 |
756.333333 |
4040.0 |
4180.0 |
70 |
-0.118602 |
-0.104424 |
-0.121914 |
0.345000 |
0.400000 |
28.0 |
True |
-11.2 |
8.6 |
28.0 |
0.0 |
0 |
0.0 |
40 |
763 |
-0.082591 |
NaN |