| 2026-04-09 07:40:01+08:00 |
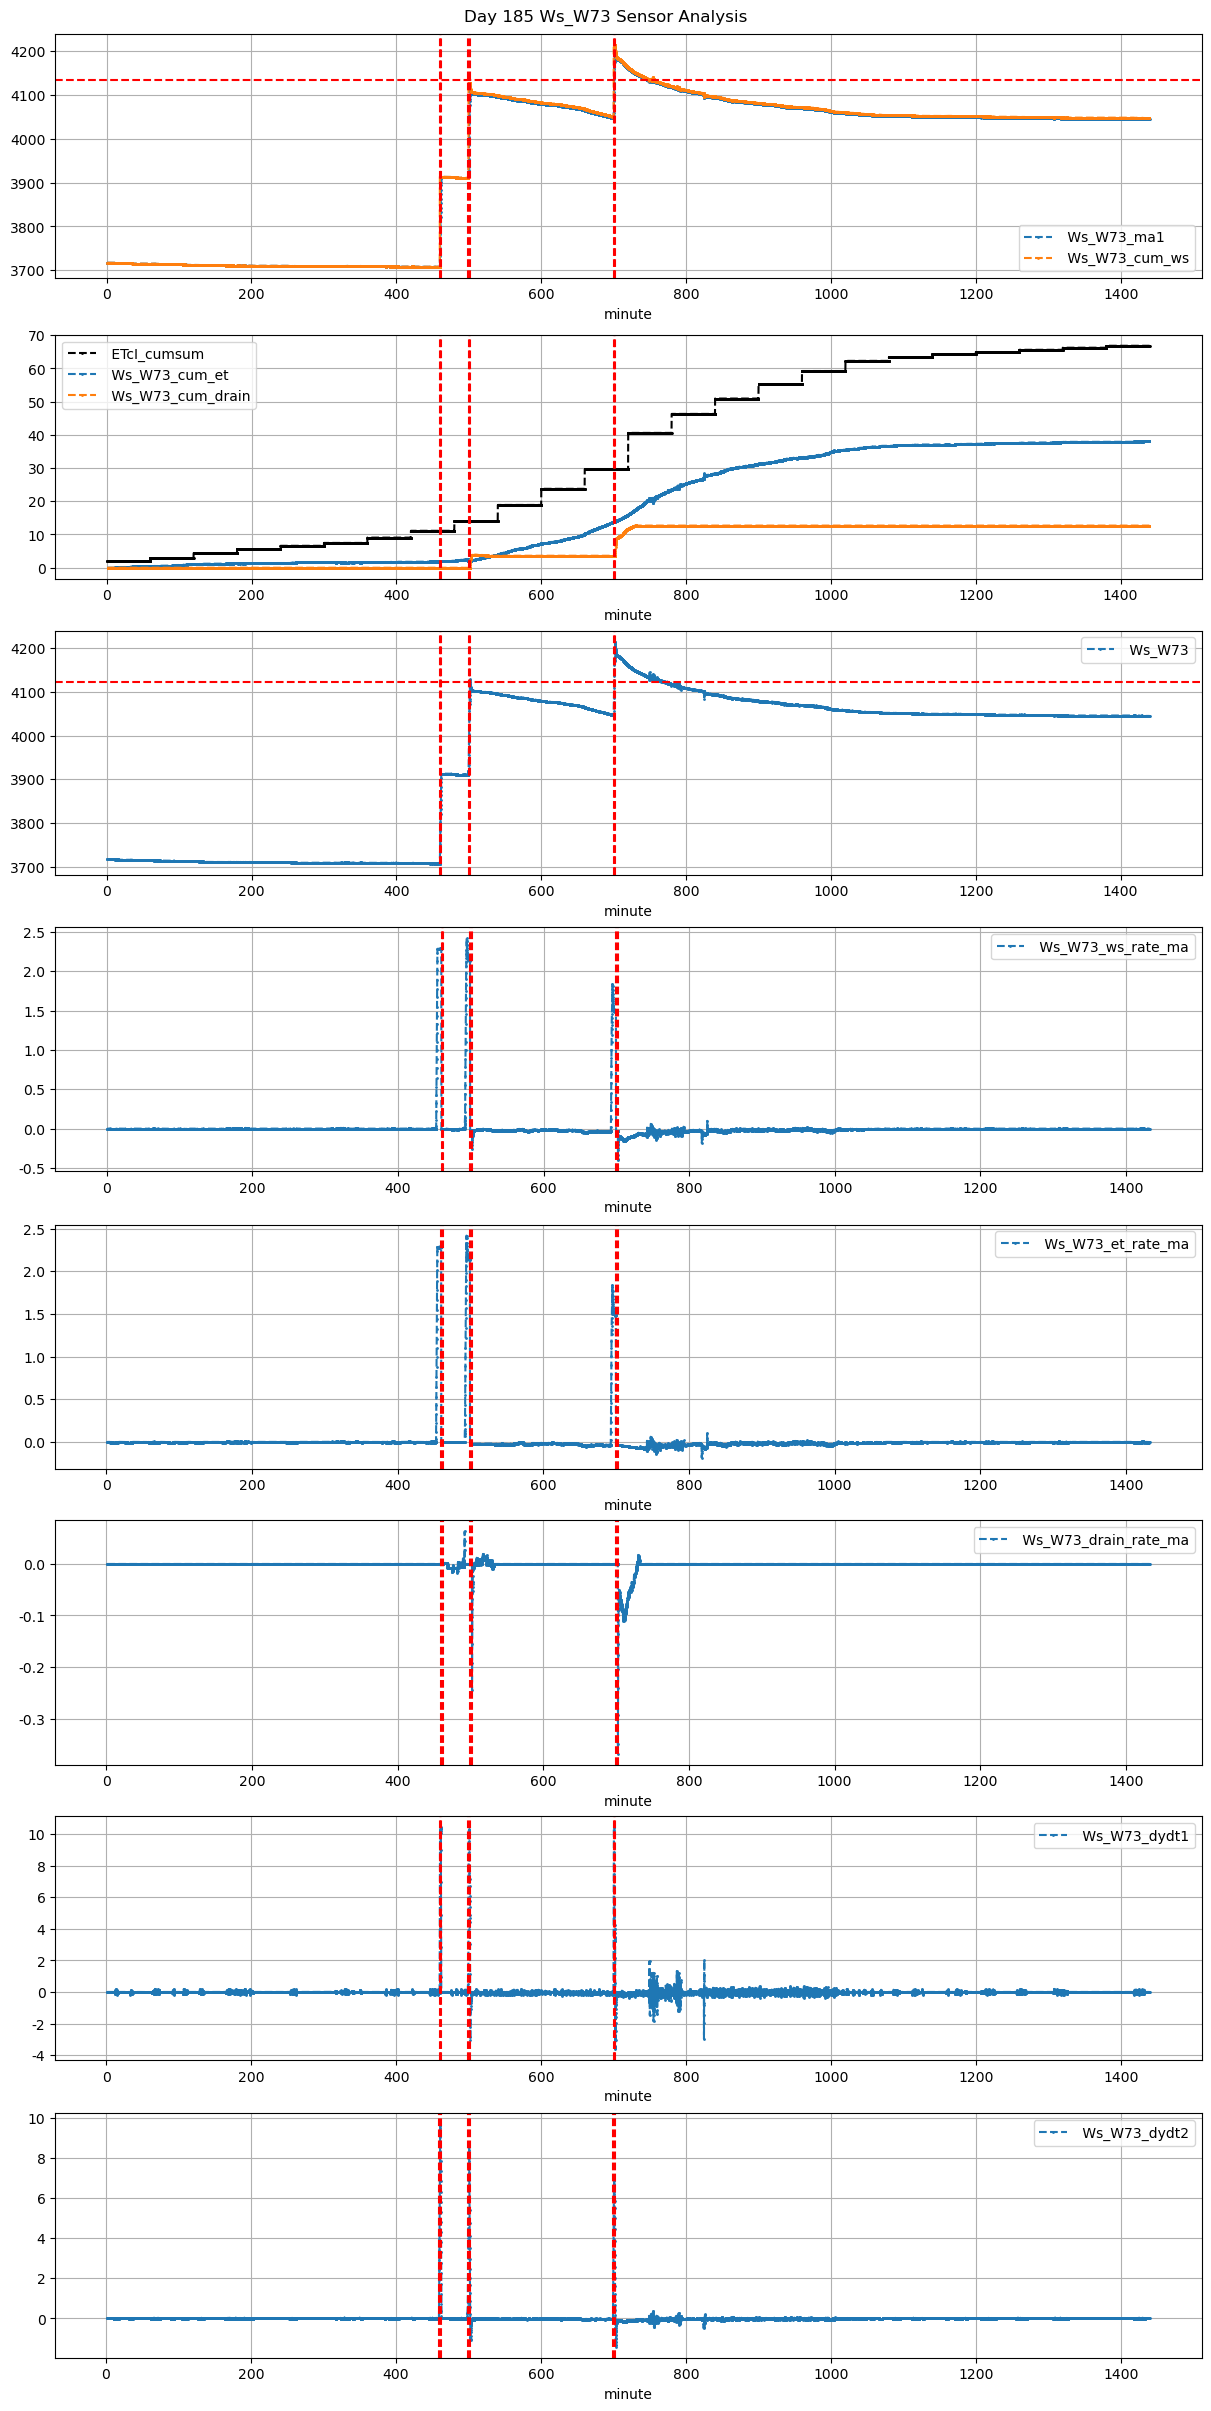
185 |
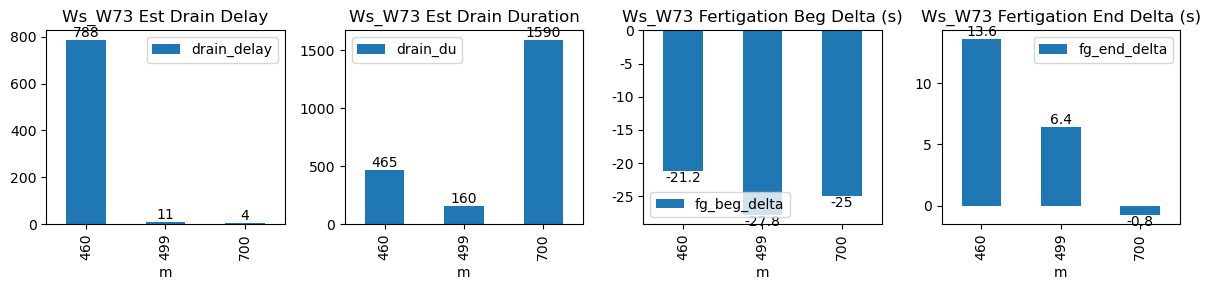
460 |
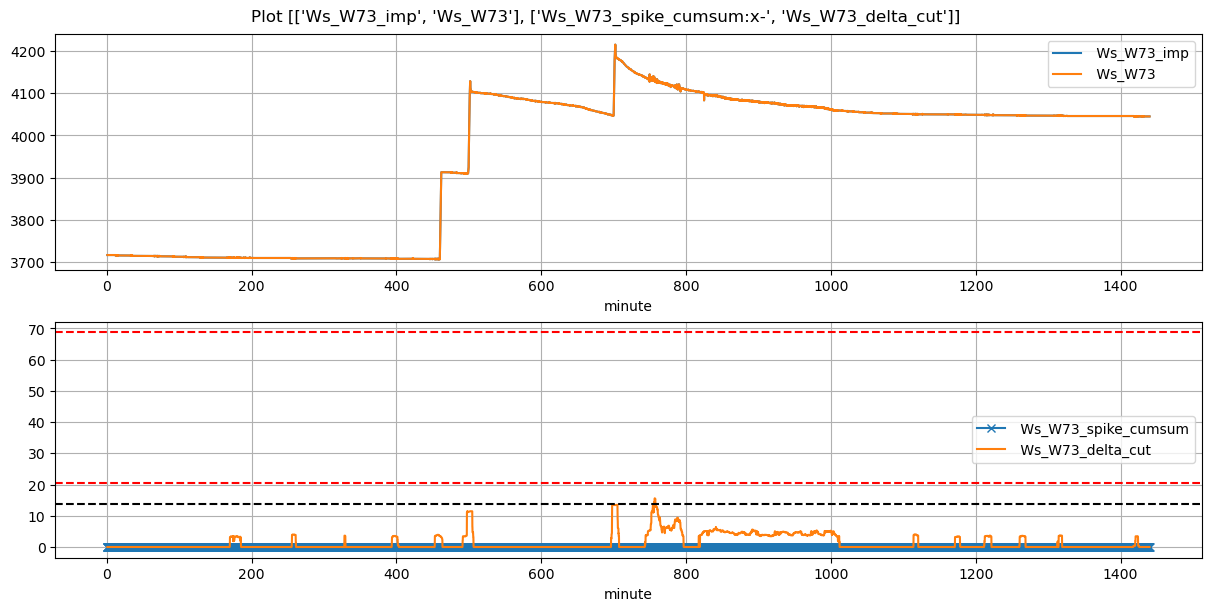
Ws_W73 |
0.232296 |
30 |
460.02 |
459.666667 |
461.69 |
461.750000 |
3707.500000 |
3913.000000 |
100 |
-0.003795 |
0.000000 |
-0.007639 |
0.351833 |
0.411000 |
41.100000 |
True |
-21.2 |
3.6 |
41.100 |
0.000000 |
0.000000 |
0.000000 |
10 |
893 |
-0.161230 |
NaN |
| 2026-04-09 08:19:38+08:00 |
185 |
499 |
Ws_W73 |
0.232296 |
30 |
499.63 |
499.166667 |
501.81 |
501.916667 |
3910.000000 |
4128.666667 |
131 |
-0.004649 |
-0.063601 |
-0.018472 |
0.321608 |
0.333842 |
43.733333 |
True |
-27.8 |
6.4 |
45.588 |
1.900000 |
4.226959 |
6.126959 |
95 |
16 |
-2.601887 |
4107.53187 |
| 2026-04-09 11:40:00+08:00 |
185 |
700 |
Ws_W73 |
0.232296 |
30 |
700.00 |
699.583333 |
702.18 |
702.250000 |
4047.433333 |
4215.000000 |
131 |
-0.036347 |
-0.138993 |
-0.071338 |
0.260583 |
0.255827 |
33.513333 |
True |
-25.0 |
4.2 |
45.588 |
4.430314 |
8.860628 |
13.290942 |
140 |
14 |
-2.645462 |
4170.69686 |