| 2026-04-14 07:32:13+08:00 |
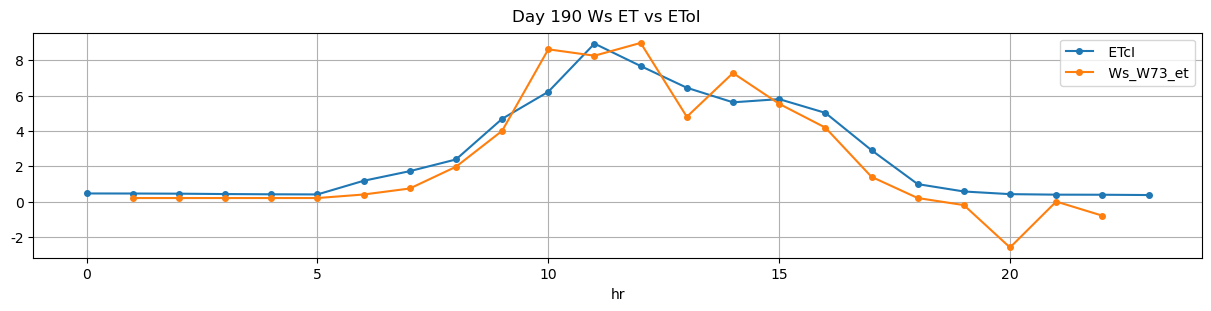
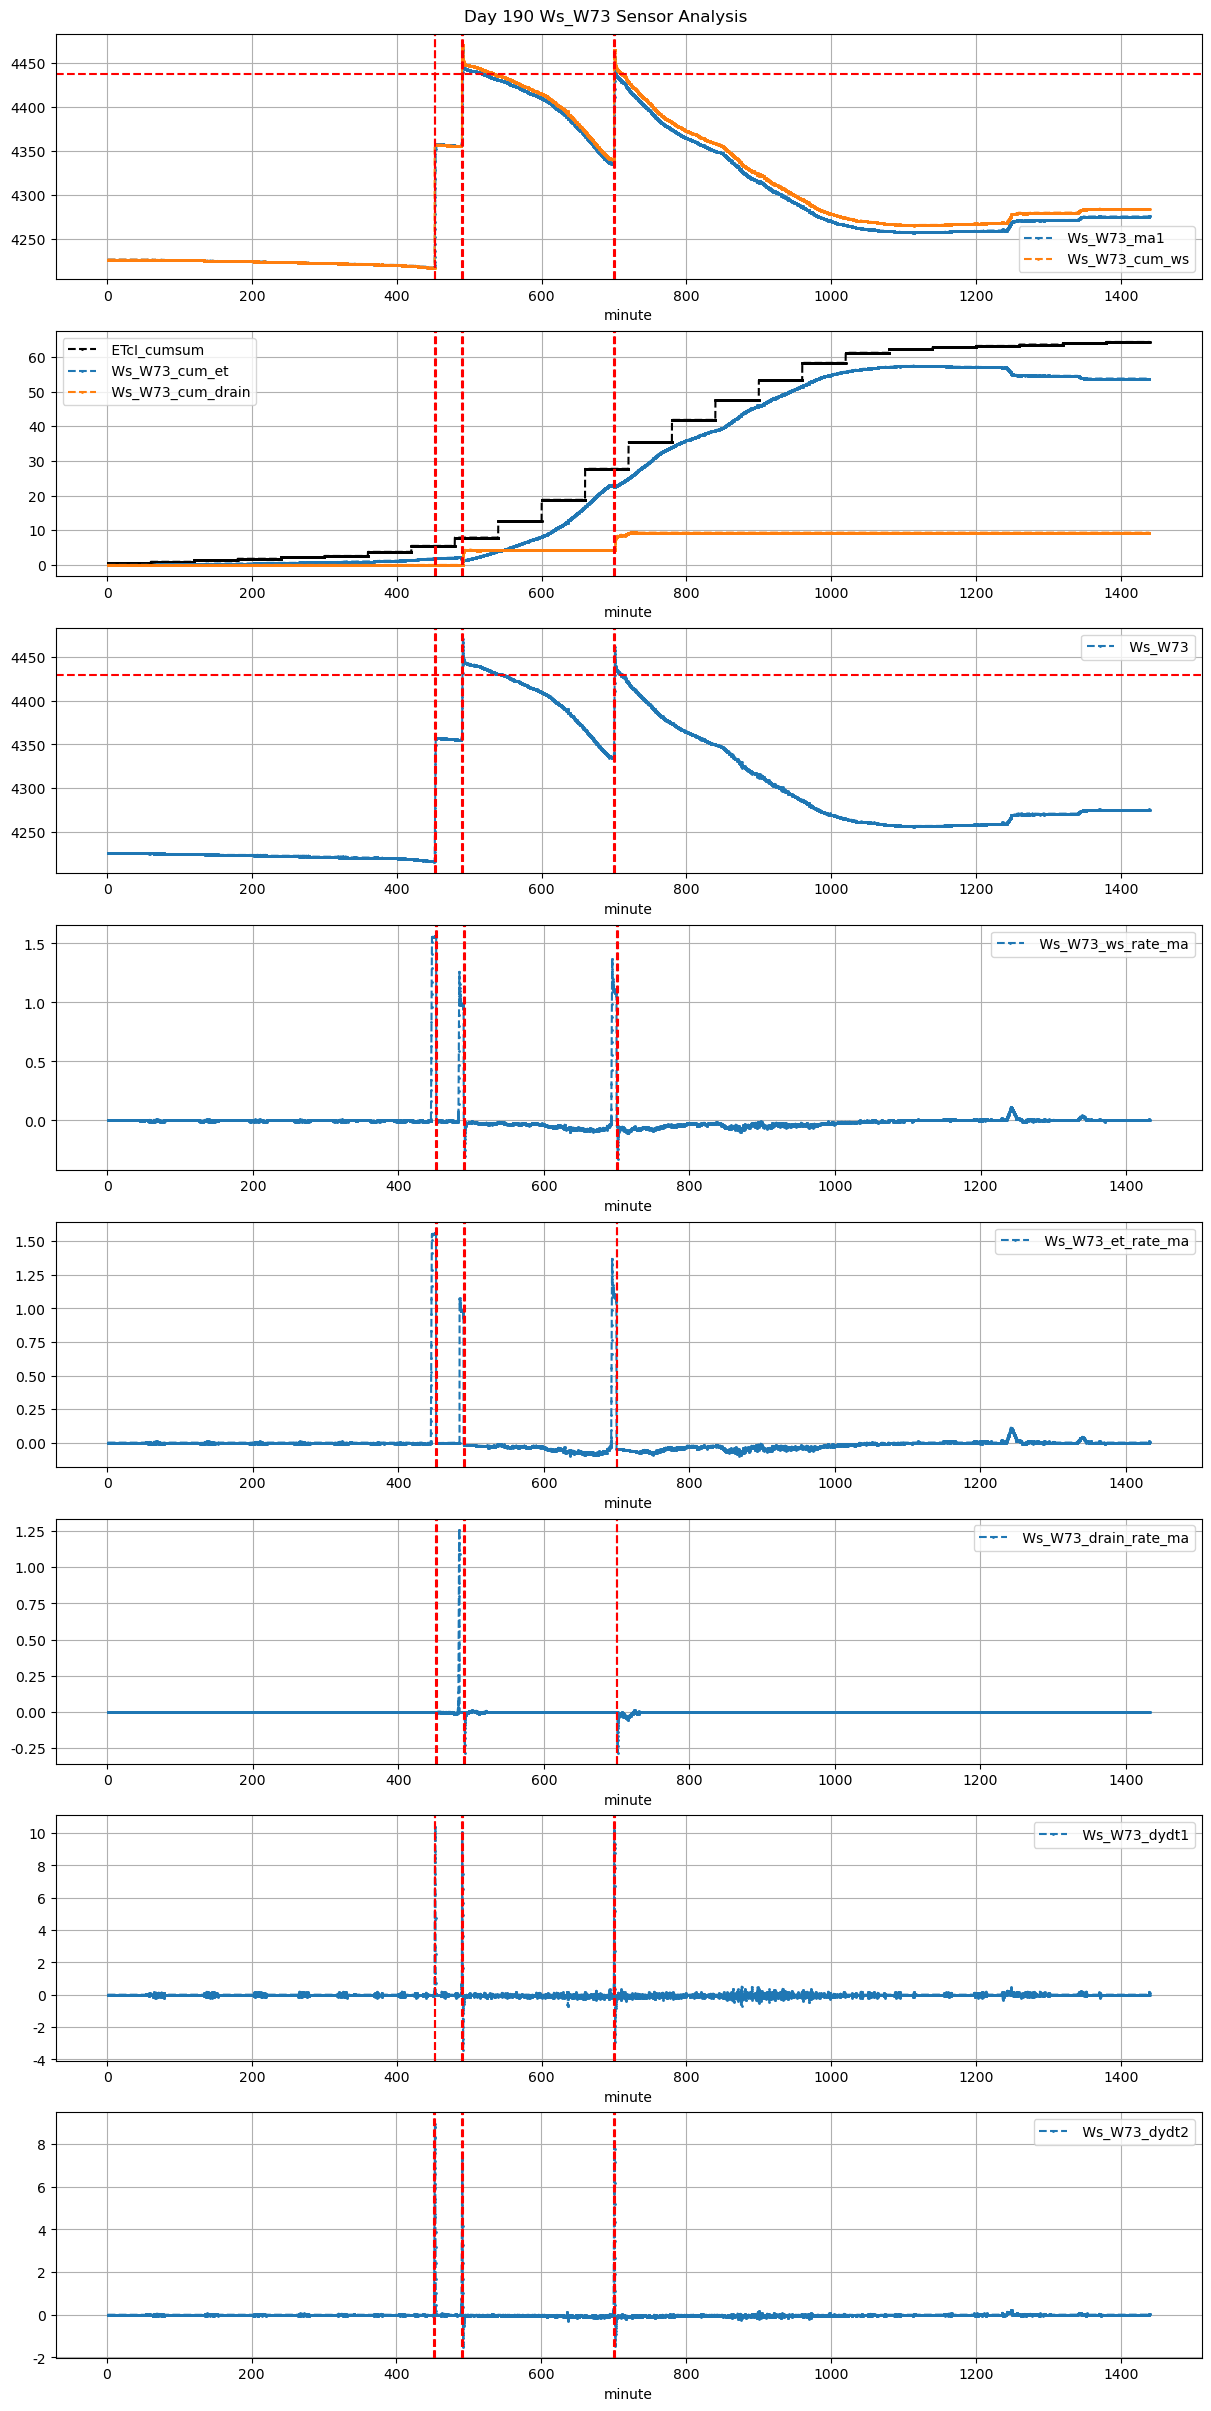
190 |
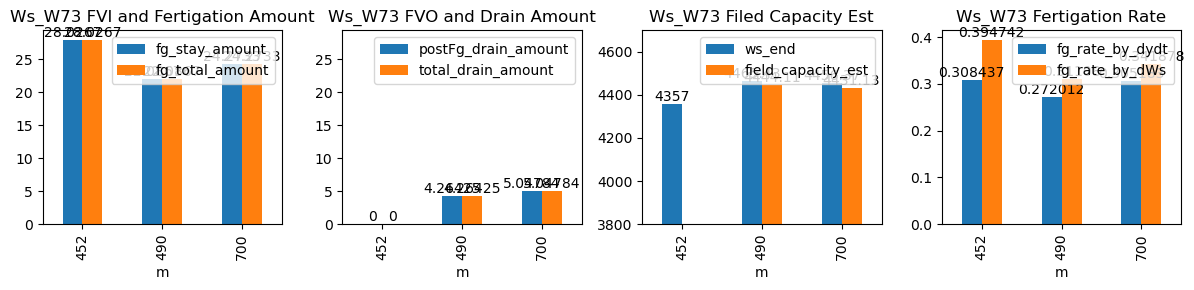
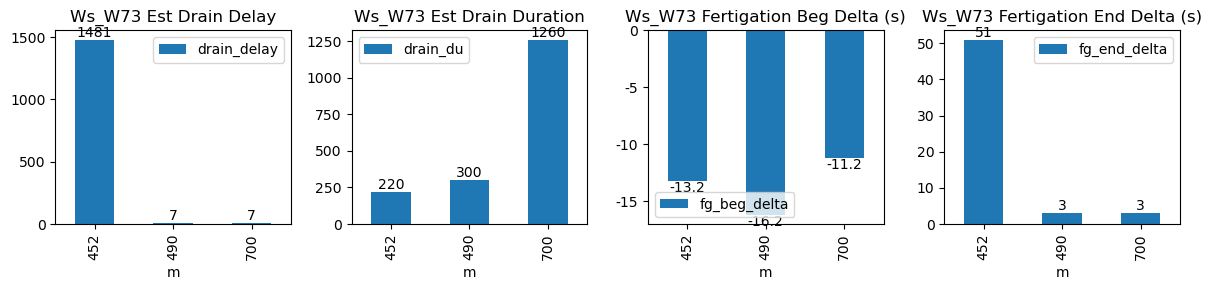
452 |
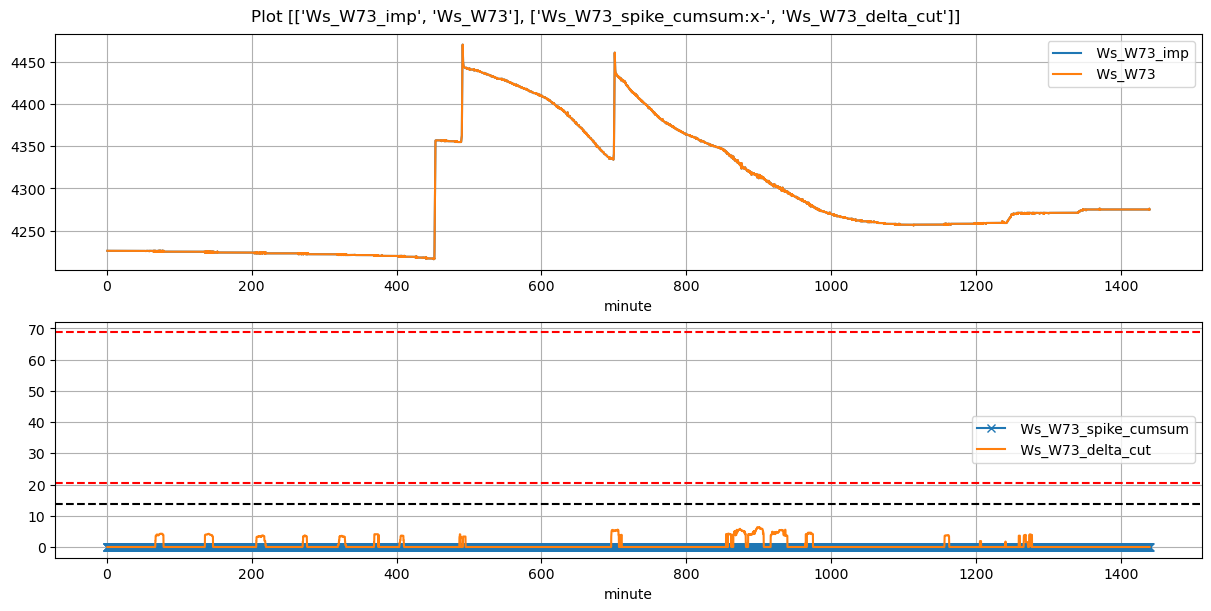
Ws_W73 |
0.24881 |
30 |
452.22 |
452.000000 |
453.4 |
454.25 |
4216.866667 |
4357.000000 |
71 |
-0.006742 |
-0.003361 |
0.000000 |
0.308437 |
0.394742 |
28.026667 |
True |
-13.2 |
51.0 |
28.026667 |
0.0 |
0.000000 |
0.000000 |
220 |
1481 |
-0.010423 |
NaN |
| 2026-04-14 08:10:01+08:00 |
190 |
490 |
Ws_W73 |
0.24881 |
30 |
490.02 |
489.750000 |
491.2 |
491.25 |
4355.000000 |
4465.433333 |
71 |
-0.016555 |
-0.037896 |
-0.026466 |
0.272012 |
0.311080 |
22.086667 |
True |
-16.2 |
3.0 |
22.086667 |
0.0 |
4.264254 |
4.264254 |
300 |
7 |
-0.046709 |
4444.112065 |
| 2026-04-14 11:40:01+08:00 |
190 |
700 |
Ws_W73 |
0.24881 |
30 |
700.02 |
699.833333 |
701.2 |
701.25 |
4335.000000 |
4456.366667 |
71 |
-0.045350 |
-0.082614 |
-0.069789 |
0.305183 |
0.341878 |
24.273333 |
True |
-11.2 |
3.0 |
24.273333 |
0.0 |
5.047838 |
5.047838 |
1260 |
7 |
-0.048639 |
4431.127478 |