| 2026-04-13 07:25:00+08:00 |
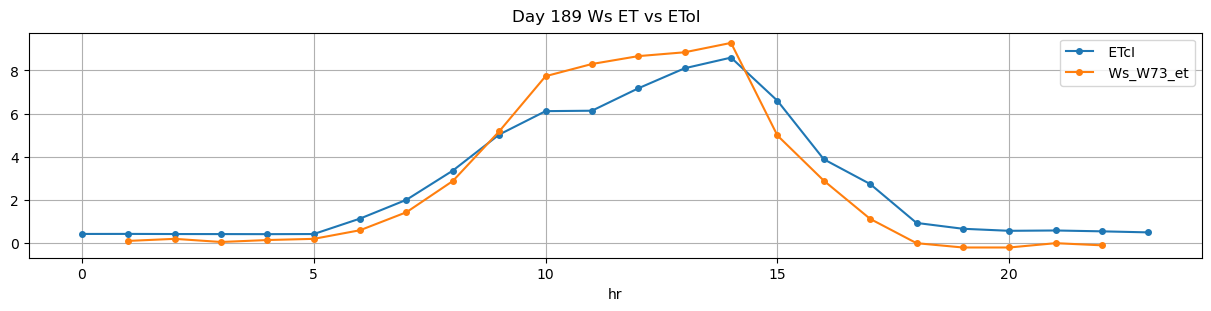
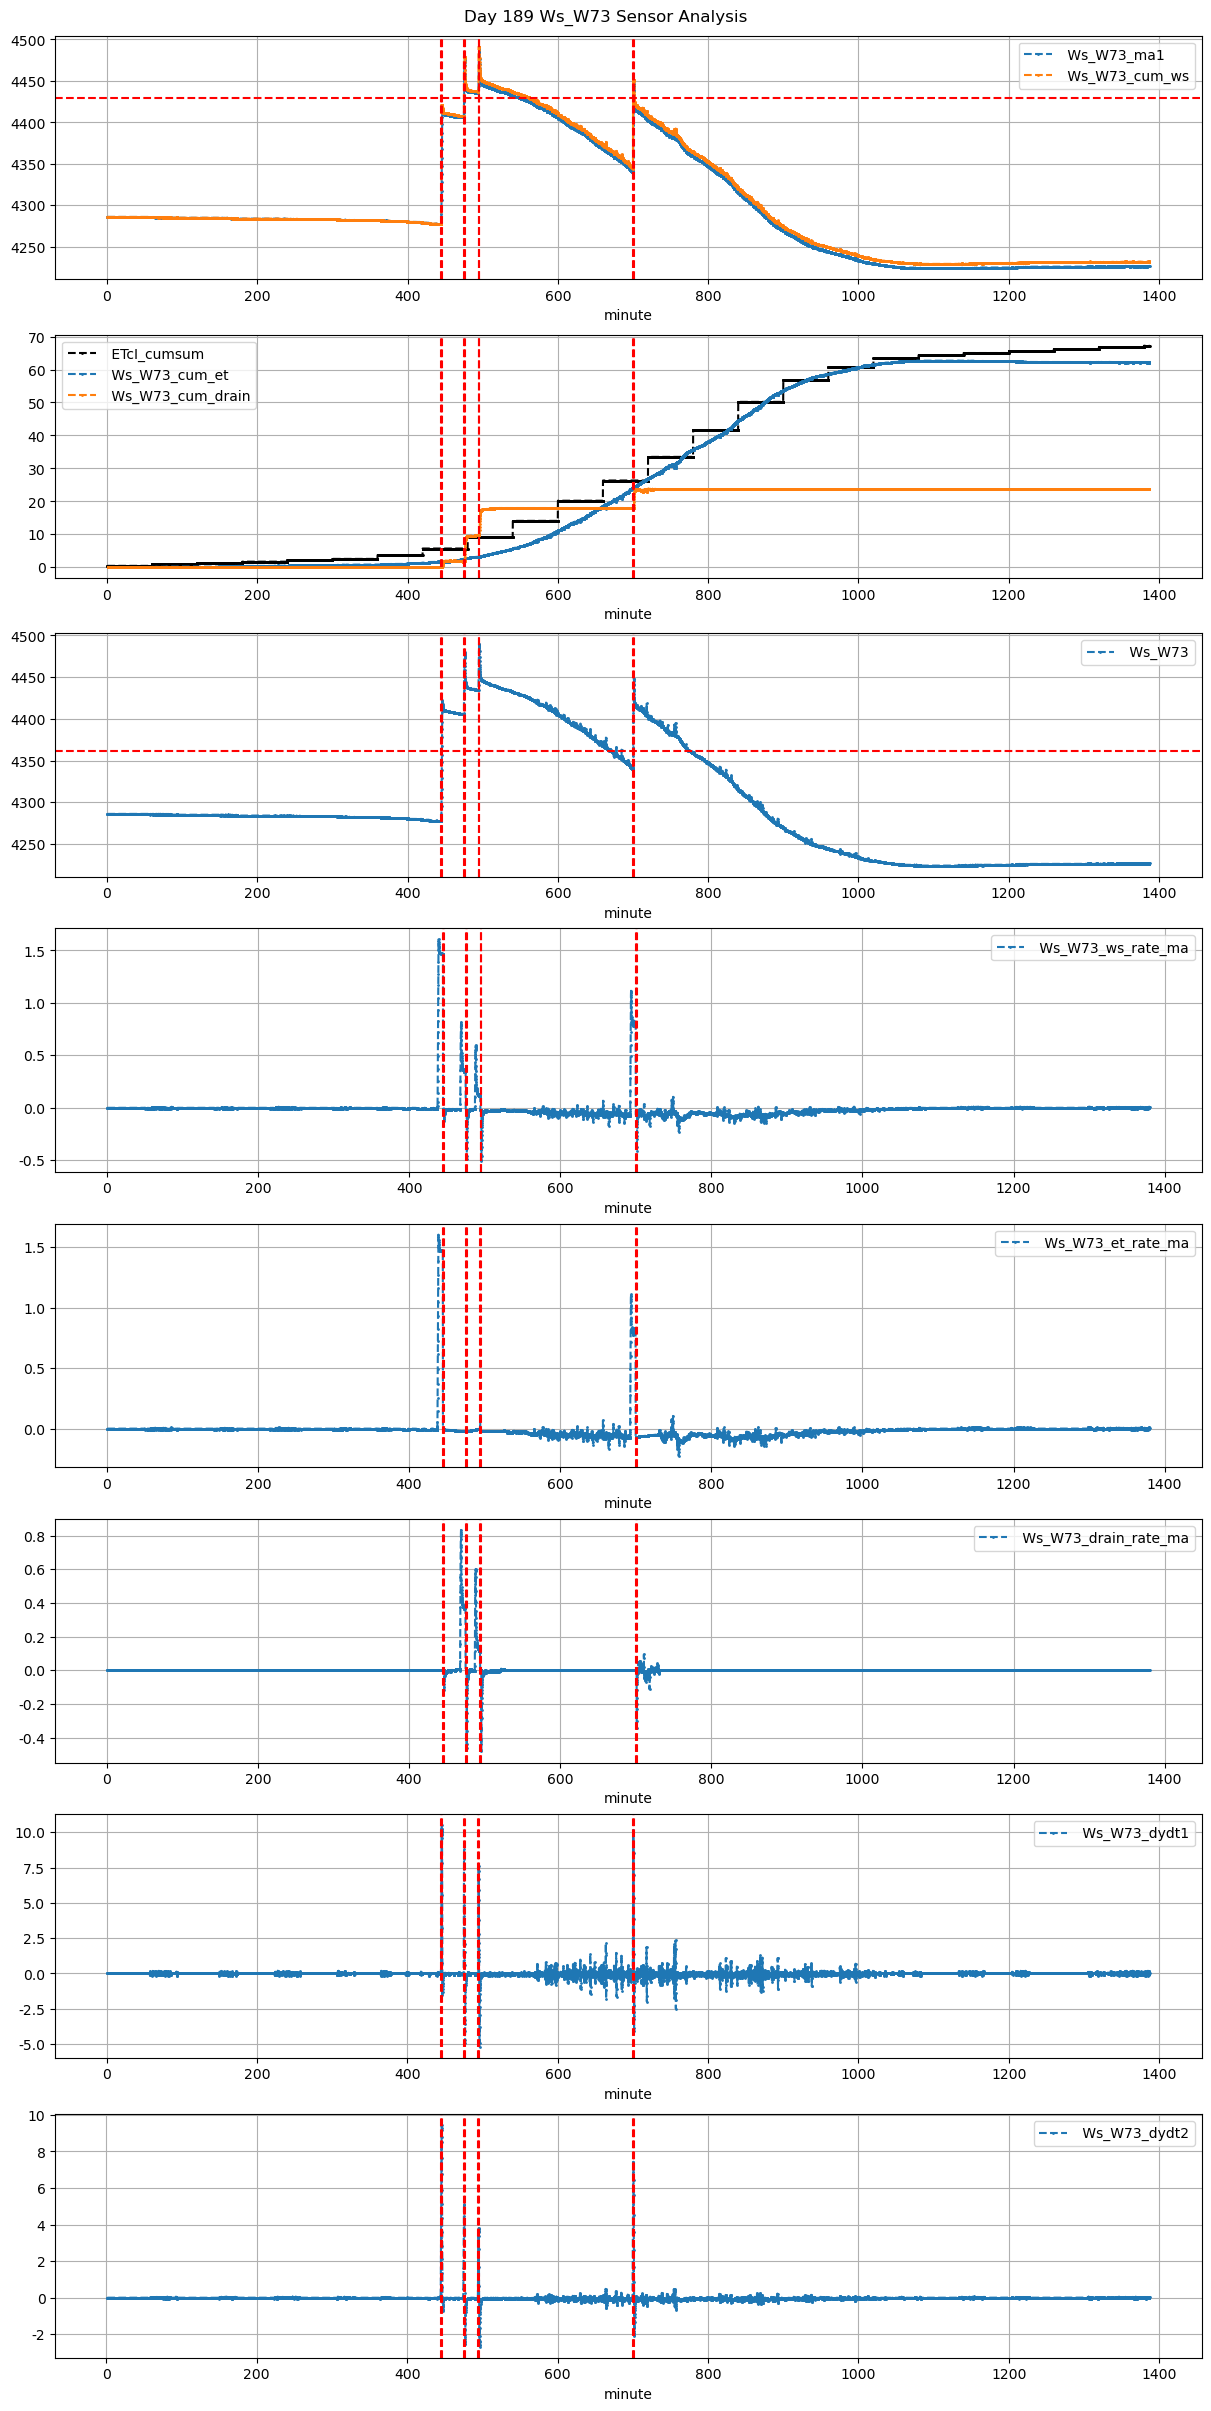
189 |
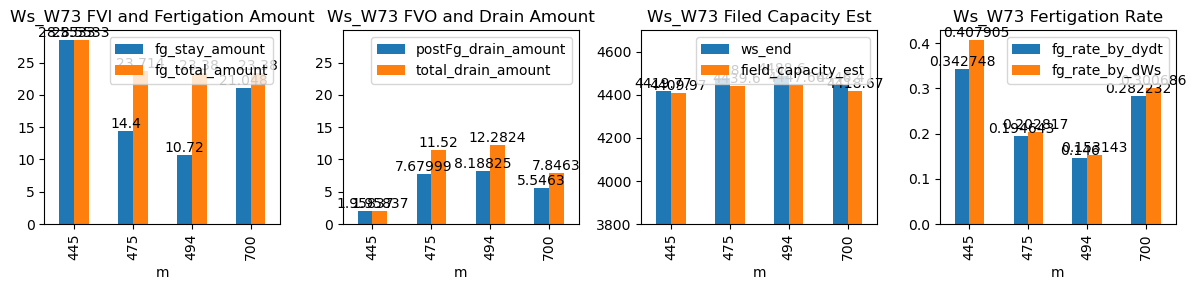
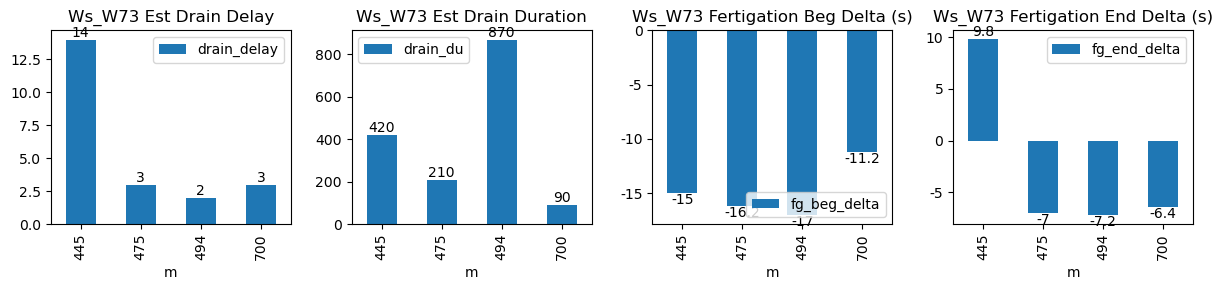
445 |
Ws_W73 |
0.537556 |
28.666667 |
445.00 |
444.750000 |
446.17 |
446.333333 |
4277.00 |
4419.766667 |
70 |
-0.007063 |
-0.021836 |
0.000000 |
0.342748 |
0.407905 |
28.553333 |
True |
-15.0 |
9.8 |
28.553333 |
0.000000 |
1.958371 |
1.958371 |
420 |
14 |
-0.032748 |
4409.974810 |
| 2026-04-13 07:55:01+08:00 |
189 |
475 |
Ws_W73 |
0.537556 |
17.800000 |
475.02 |
474.750000 |
476.20 |
476.083333 |
4406.00 |
4478.000000 |
71 |
-0.023342 |
-0.053416 |
0.000000 |
0.194643 |
0.202817 |
14.400000 |
True |
-16.2 |
-7.0 |
23.714000 |
3.839997 |
7.679994 |
11.519991 |
210 |
3 |
-0.260888 |
4439.600031 |
| 2026-04-13 08:14:27+08:00 |
189 |
494 |
Ws_W73 |
0.537556 |
30.000000 |
494.45 |
494.166667 |
495.62 |
495.500000 |
4435.00 |
4488.600000 |
70 |
-0.023342 |
-0.066029 |
-0.021564 |
0.146000 |
0.153143 |
10.720000 |
True |
-17.0 |
-7.2 |
23.380000 |
4.094124 |
8.188248 |
12.282372 |
870 |
2 |
-0.039241 |
4447.658761 |
| 2026-04-13 11:40:01+08:00 |
189 |
700 |
Ws_W73 |
0.537556 |
30.000000 |
700.02 |
699.833333 |
701.19 |
701.083333 |
4341.16 |
4446.400000 |
70 |
-0.067098 |
-0.073235 |
-0.047158 |
0.282232 |
0.300686 |
21.048000 |
True |
-11.2 |
-6.4 |
23.380000 |
2.300000 |
5.546301 |
7.846301 |
90 |
3 |
-0.069698 |
4418.668497 |