| 2026-04-03 07:40:00+08:00 |
179 |
460 |
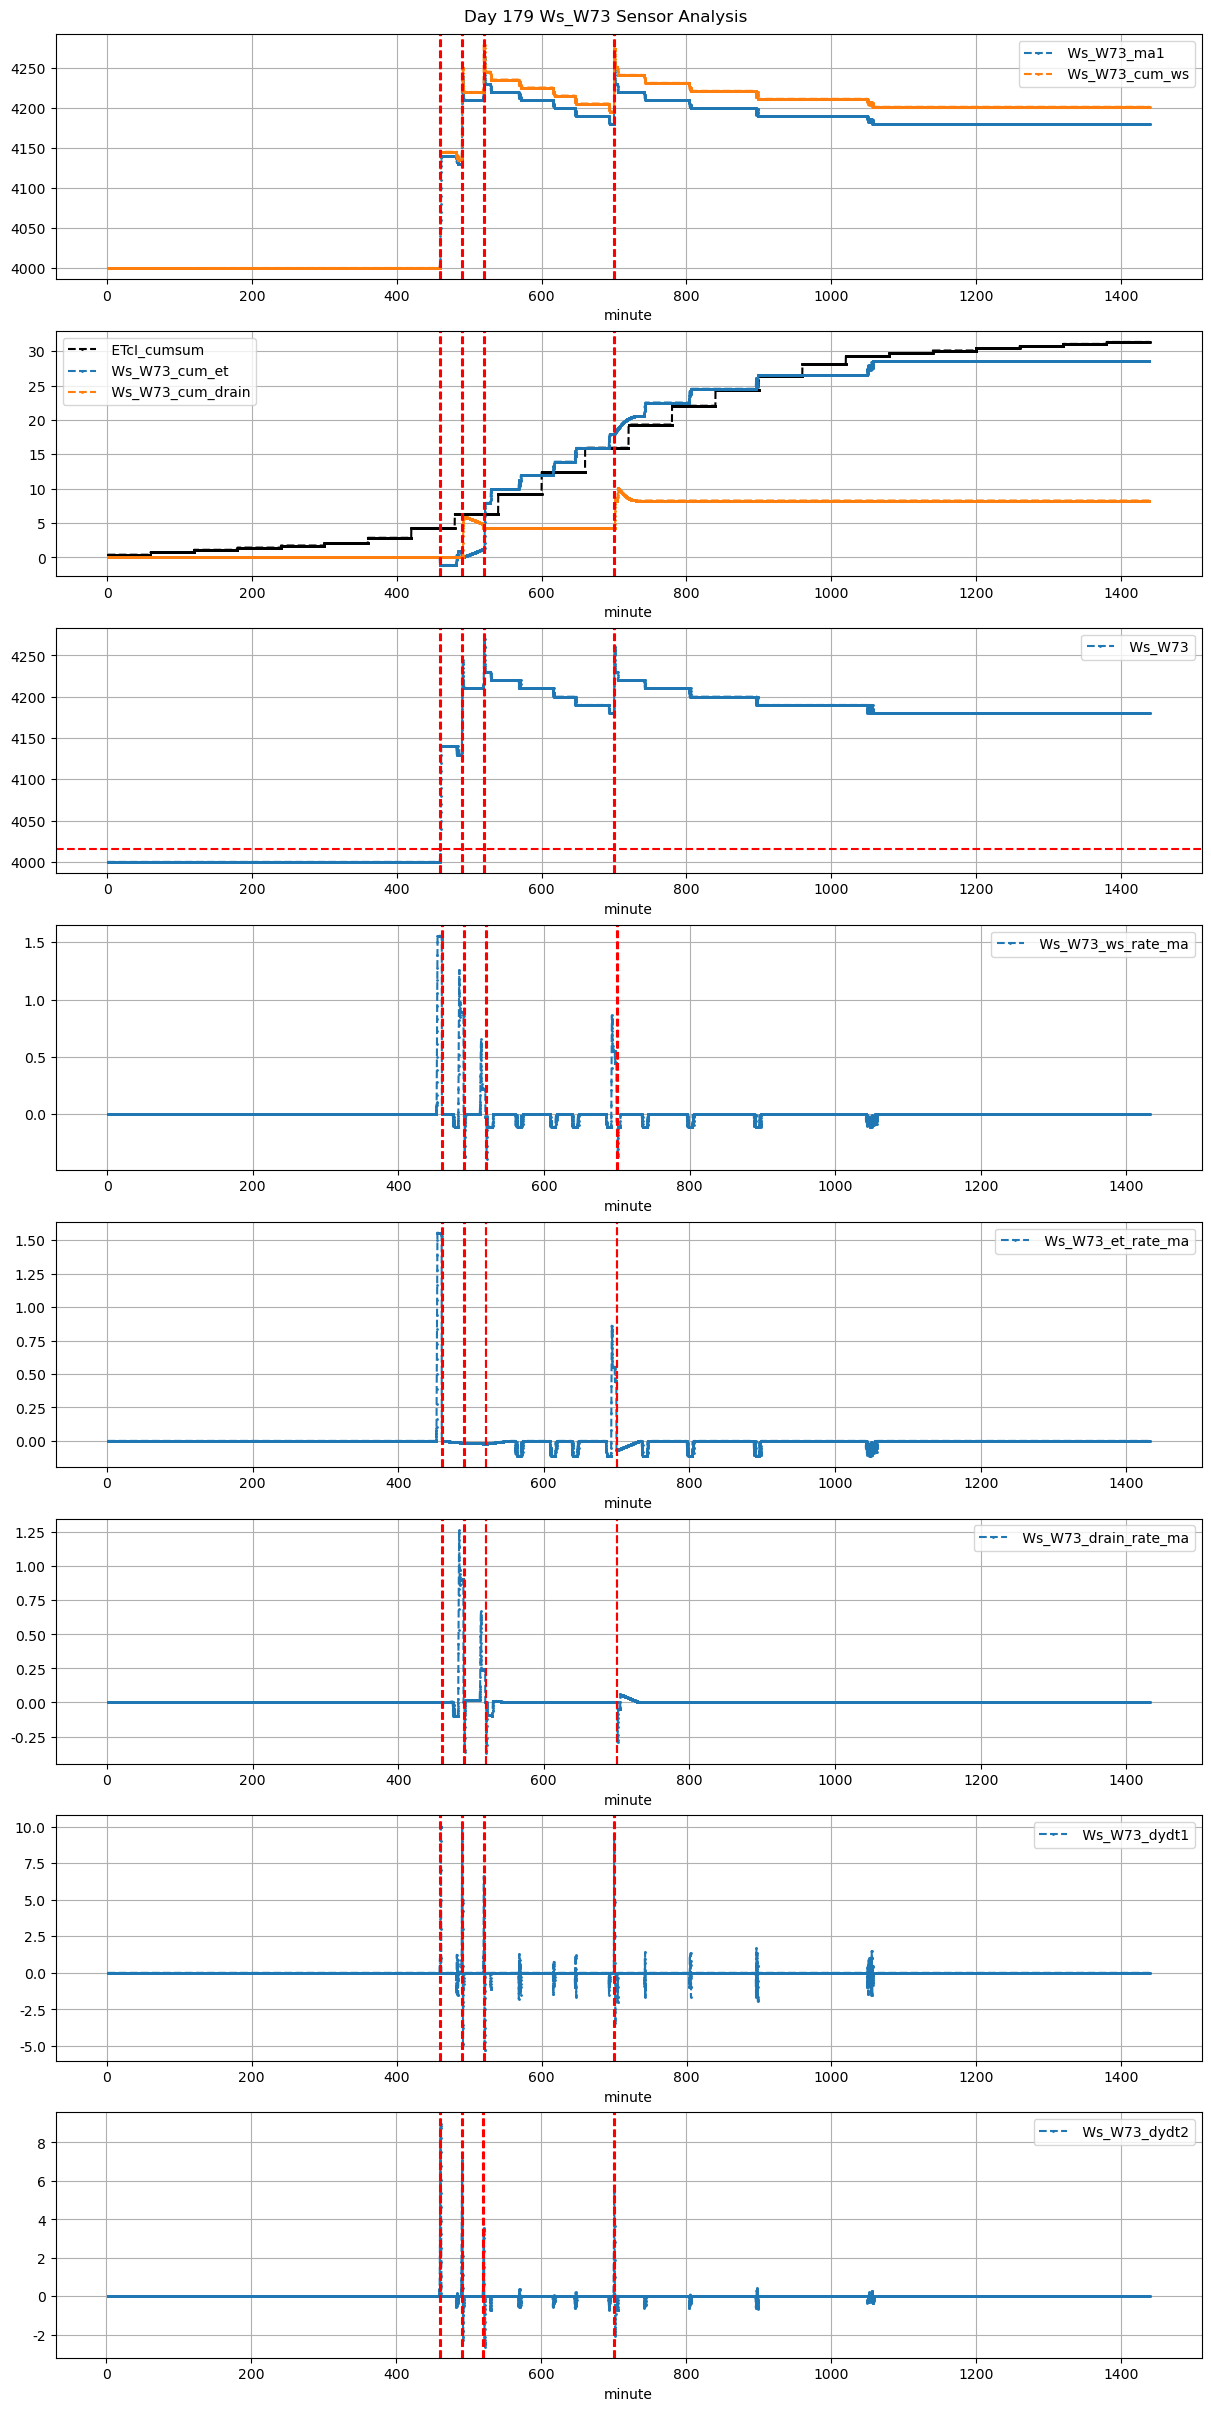
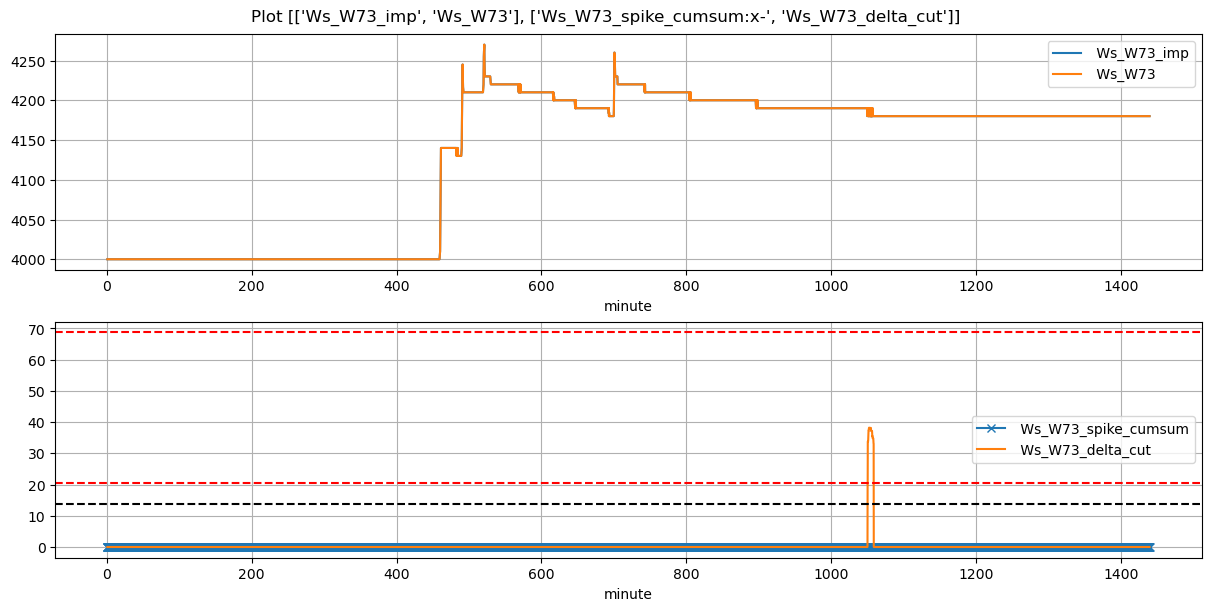
Ws_W73 |
2.21827 |
28.583333 |
460.0 |
459.833333 |
461.18 |
461.416667 |
4000.0 |
4140.0 |
71 |
0.000000 |
0.000000 |
0.0 |
0.330000 |
0.394366 |
28.00 |
True |
-10.0 |
14.2 |
28.0000 |
0.0 |
0.0 |
0.0 |
315 |
964 |
-0.102846 |
NaN |
| 2026-04-03 08:10:00+08:00 |
179 |
490 |
Ws_W73 |
2.21827 |
28.820000 |
490.0 |
489.666667 |
491.18 |
491.166667 |
4130.0 |
4240.5 |
71 |
-0.014405 |
-0.020525 |
0.0 |
0.265714 |
0.311268 |
22.10 |
True |
-20.0 |
-0.8 |
22.1000 |
0.0 |
0.0 |
0.0 |
64 |
4 |
-0.352236 |
NaN |
| 2026-04-03 08:40:00+08:00 |
179 |
520 |
Ws_W73 |
2.21827 |
30.000000 |
520.0 |
519.583333 |
521.20 |
521.000000 |
4210.0 |
4265.9 |
72 |
-0.019984 |
-0.112963 |
0.0 |
0.138762 |
0.155278 |
11.18 |
True |
-25.0 |
-12.0 |
17.6760 |
0.0 |
0.0 |
0.0 |
45 |
2 |
-0.096556 |
NaN |
| 2026-04-03 11:40:00+08:00 |
179 |
700 |
Ws_W73 |
2.21827 |
30.000000 |
700.0 |
699.750000 |
701.18 |
700.833333 |
4180.0 |
4258.0 |
71 |
-0.097690 |
-0.067695 |
0.0 |
0.218333 |
0.219718 |
15.60 |
True |
-15.0 |
-20.8 |
17.4305 |
0.0 |
0.0 |
0.0 |
225 |
4 |
-0.227351 |
NaN |