| 2026-04-12 07:40:00+08:00 |
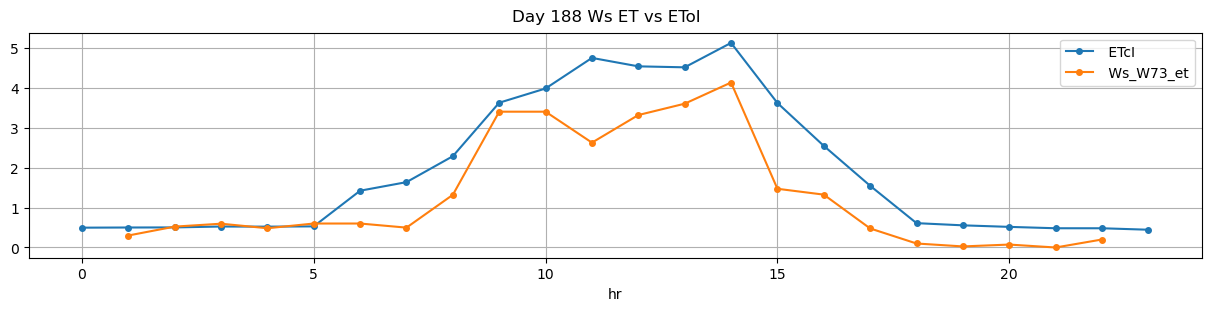
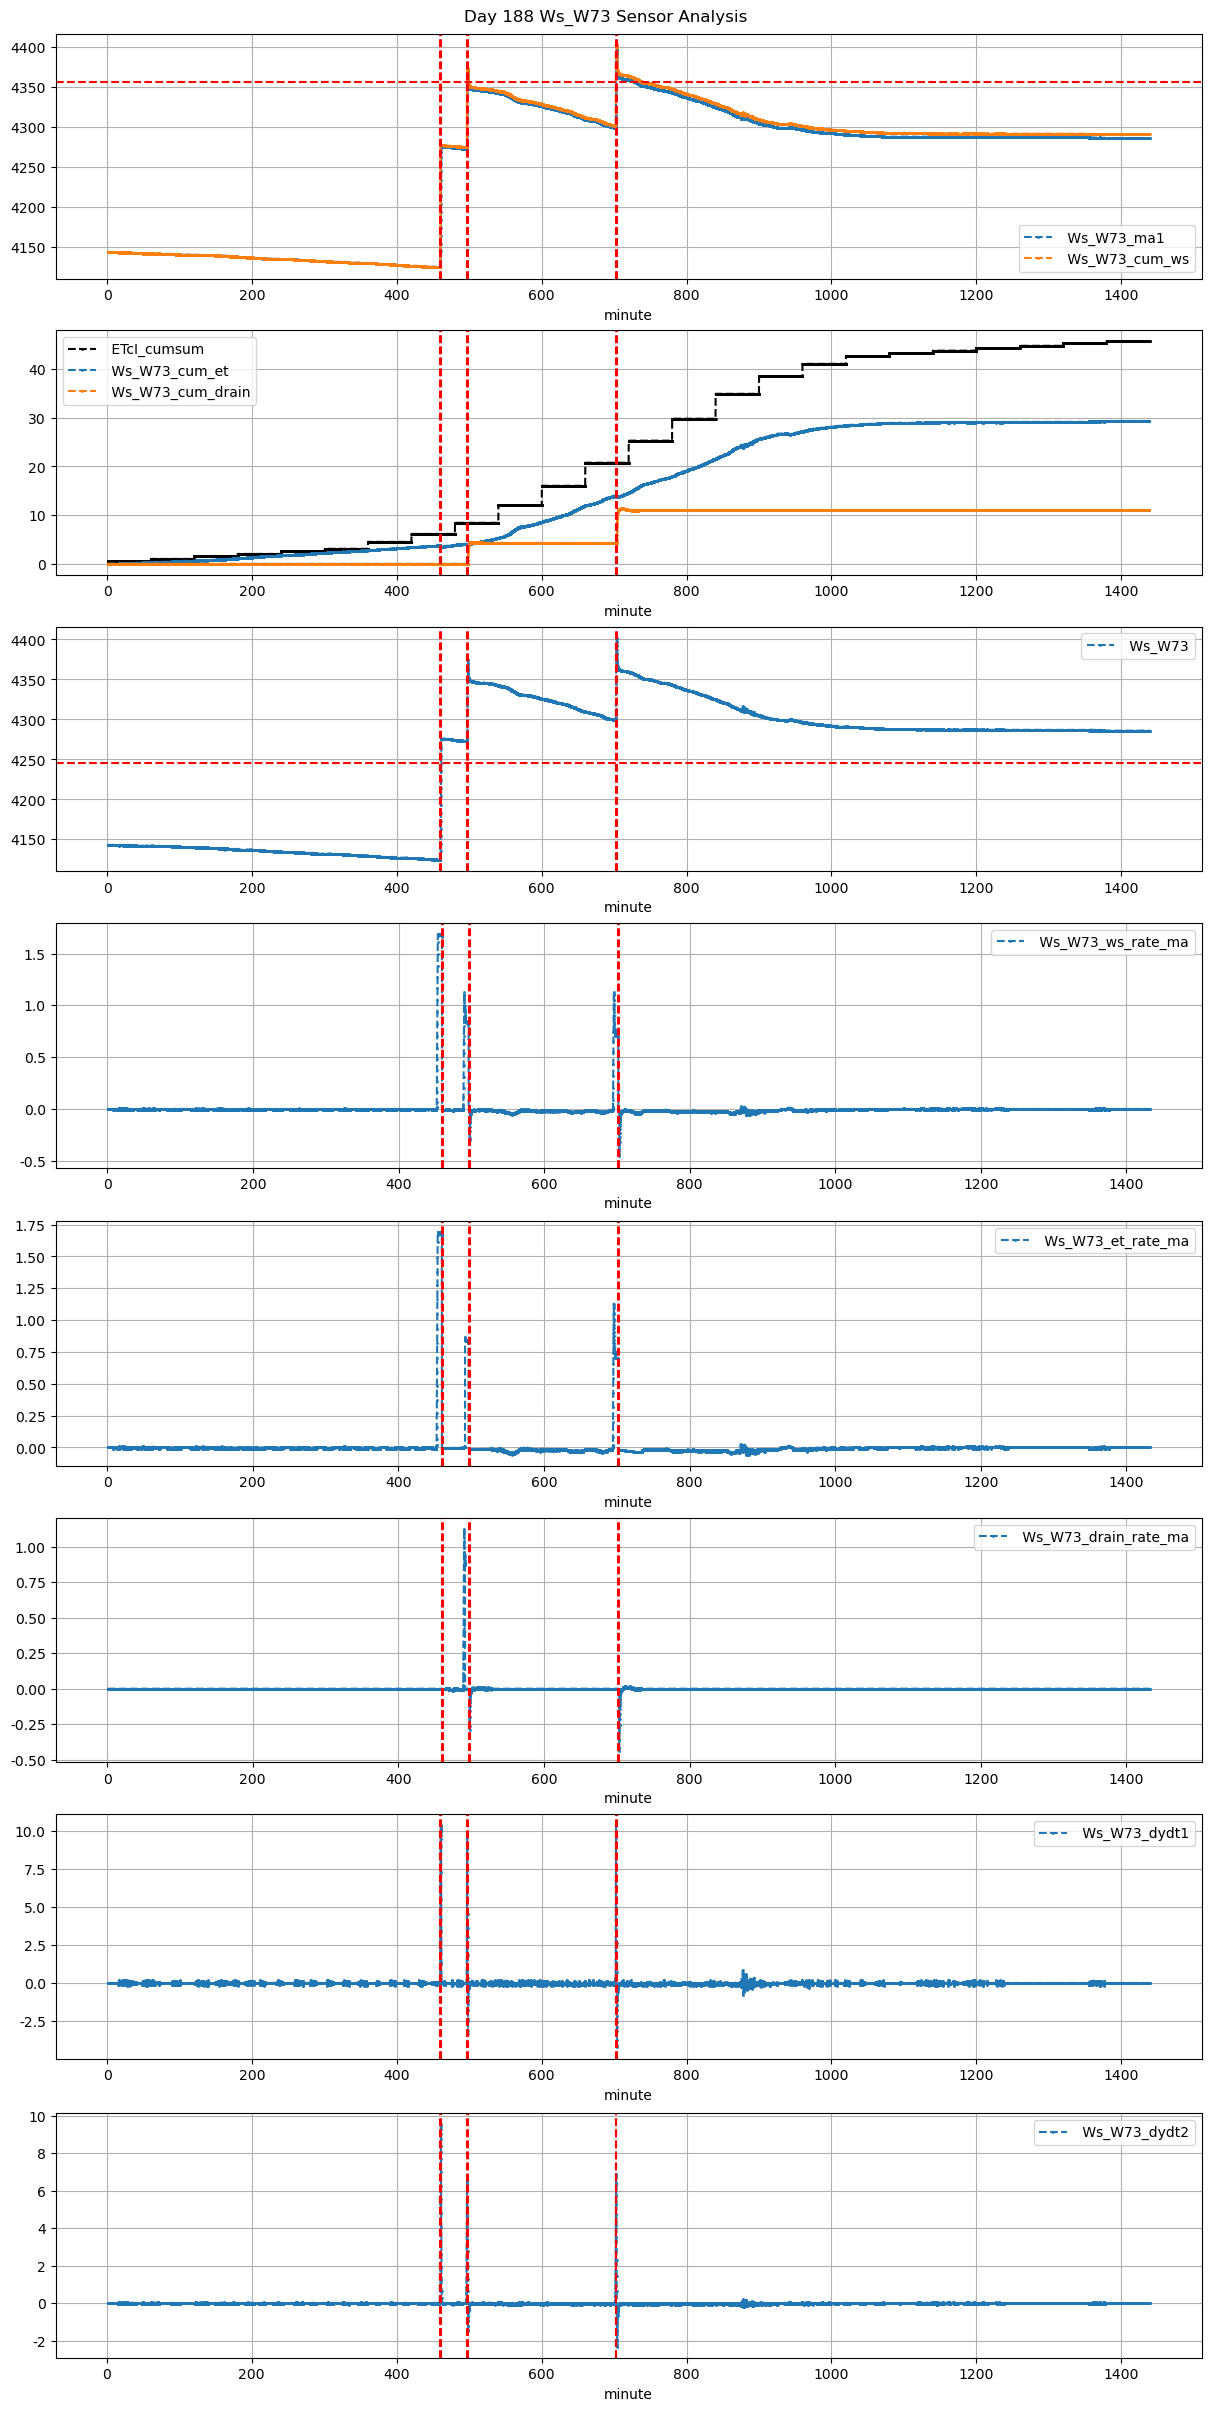
188 |
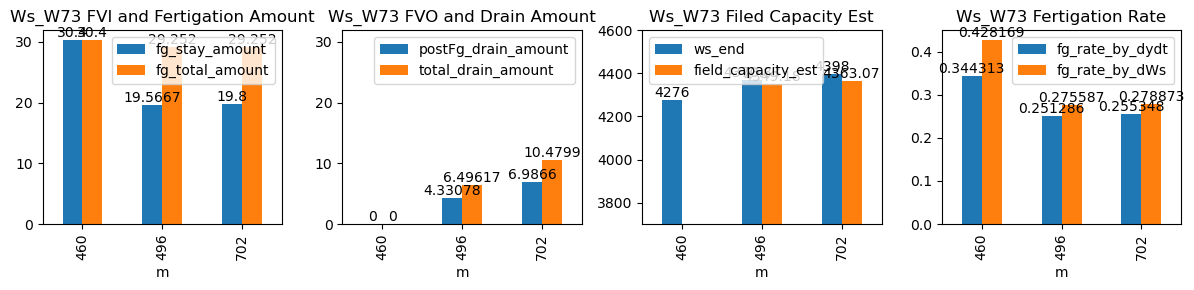
460 |
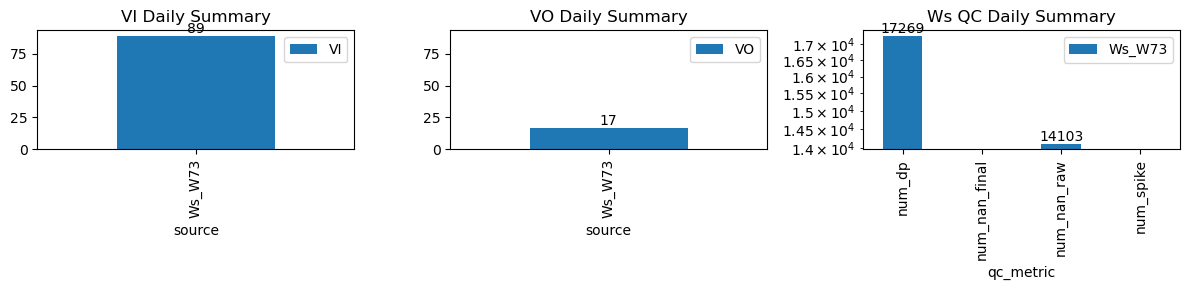
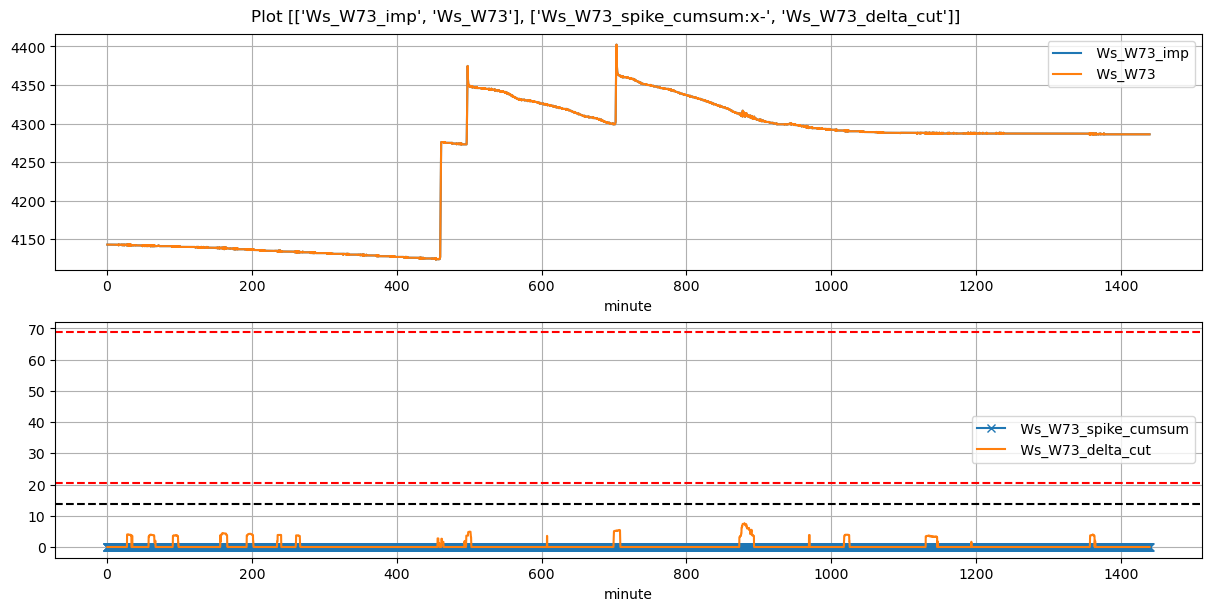
Ws_W73 |
0.298128 |
30 |
460.00 |
459.750000 |
461.18 |
461.583333 |
4124.0 |
4276.000000 |
71 |
-0.006646 |
-0.006782 |
0.000000 |
0.344313 |
0.428169 |
30.400000 |
True |
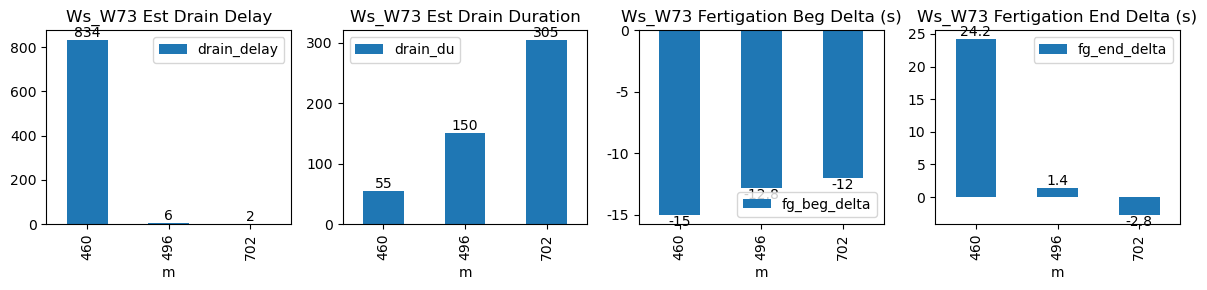
-15.0 |
24.2 |
30.400 |
0.000000 |
0.000000 |
0.000000 |
55 |
834 |
-0.010047 |
NaN |
| 2026-04-12 08:16:38+08:00 |
188 |
496 |
Ws_W73 |
0.298128 |
30 |
496.63 |
496.416667 |
497.81 |
497.833333 |
4273.0 |
4370.833333 |
71 |
-0.015872 |
-0.037263 |
-0.009427 |
0.251286 |
0.275587 |
19.566667 |
True |
-12.8 |
1.4 |
29.252 |
2.165391 |
4.330782 |
6.496174 |
150 |
6 |
-0.080279 |
4349.179421 |
| 2026-04-12 11:42:12+08:00 |
188 |
702 |
Ws_W73 |
0.298128 |
30 |
702.20 |
702.000000 |
703.38 |
703.333333 |
4299.0 |
4398.000000 |
71 |
-0.018027 |
-0.056502 |
-0.039403 |
0.255348 |
0.278873 |
19.800000 |
True |
-12.0 |
-2.8 |
29.252 |
3.493300 |
6.986600 |
10.479900 |
305 |
2 |
-0.130923 |
4363.067000 |