| 2026-04-11 07:20:01+08:00 |
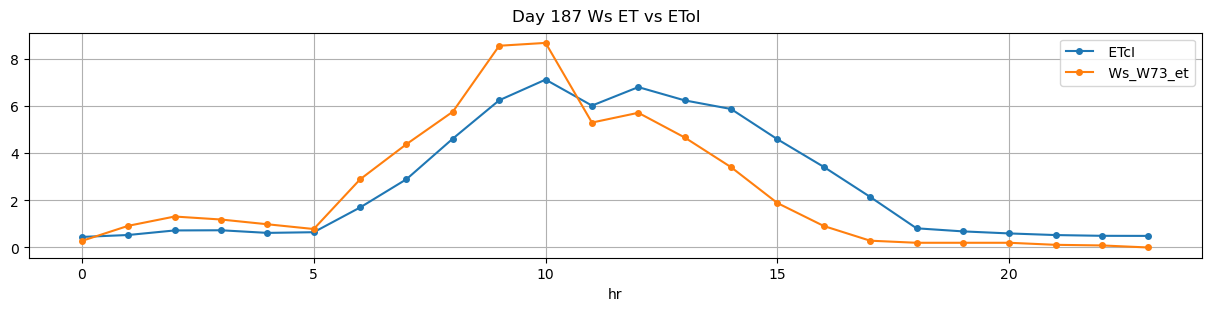
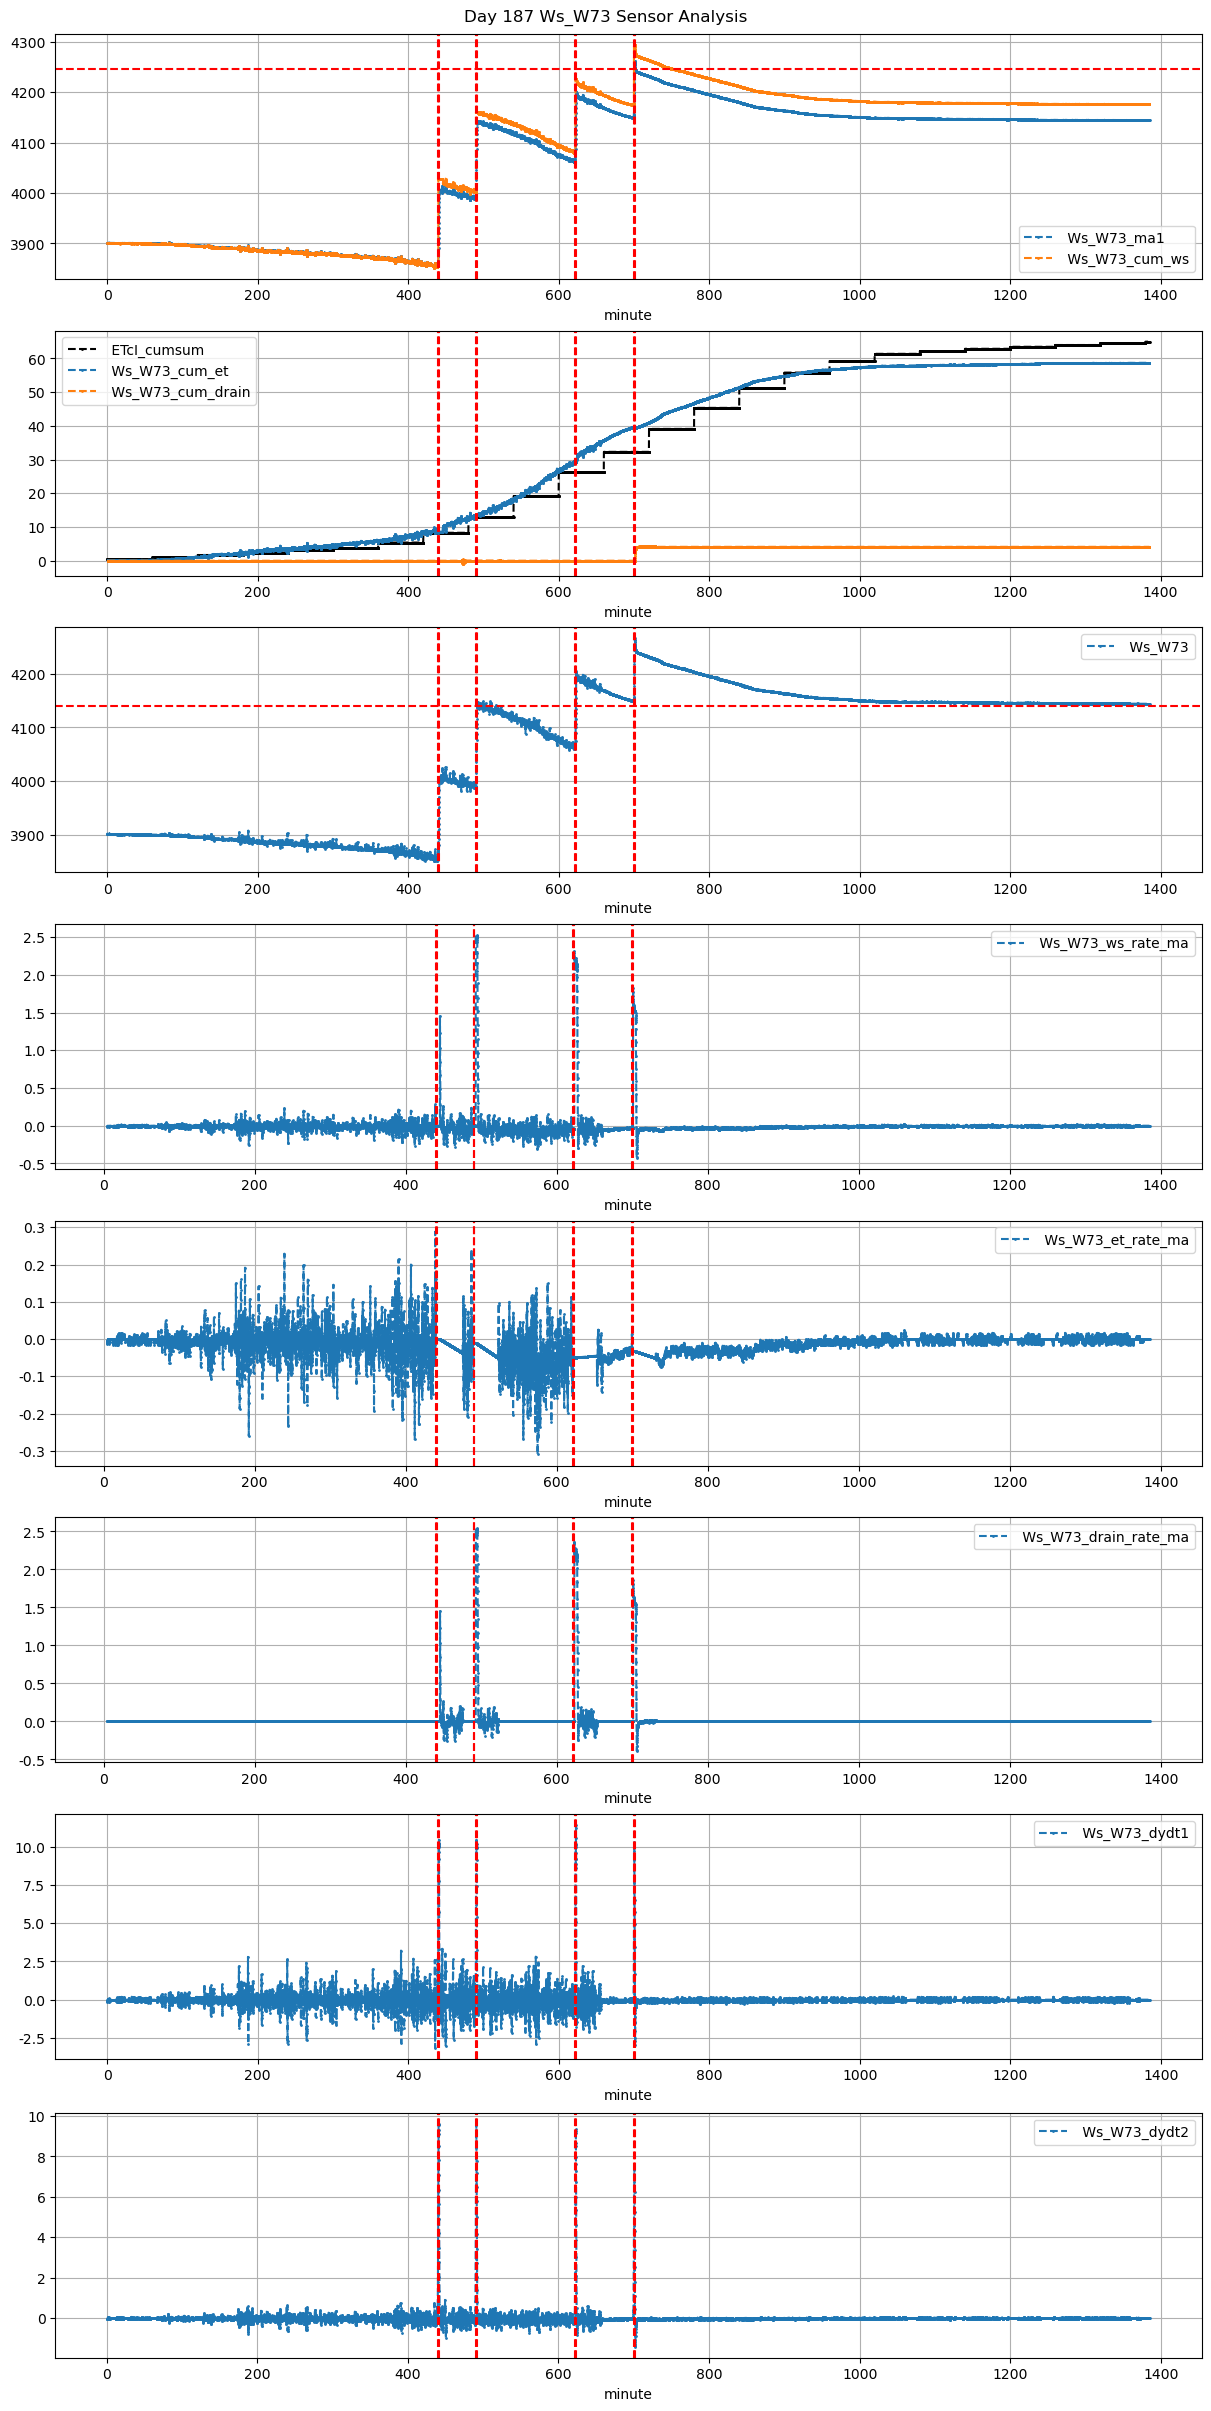
187 |
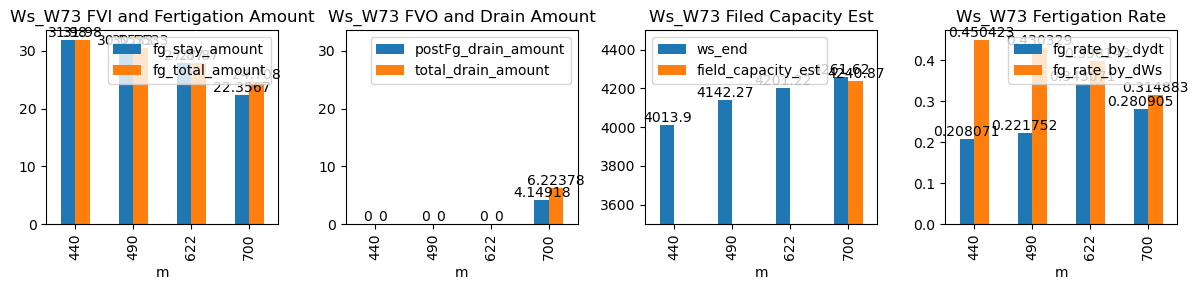
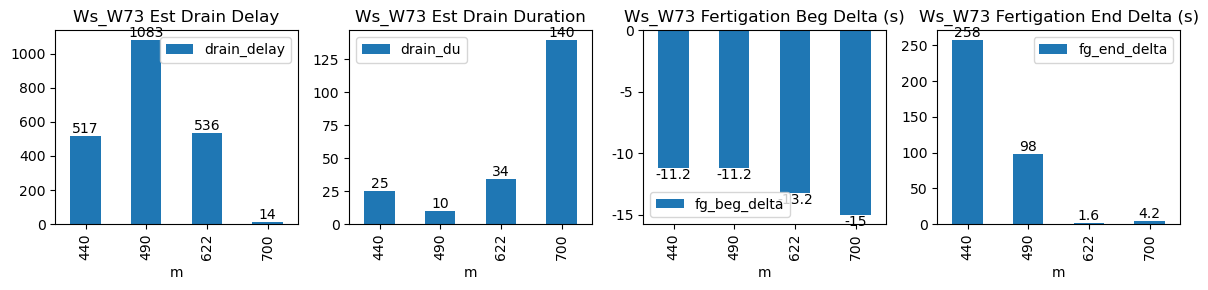
440 |
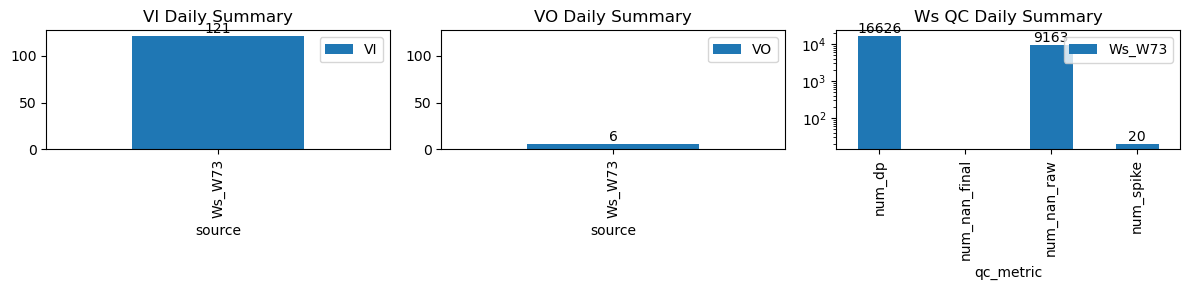
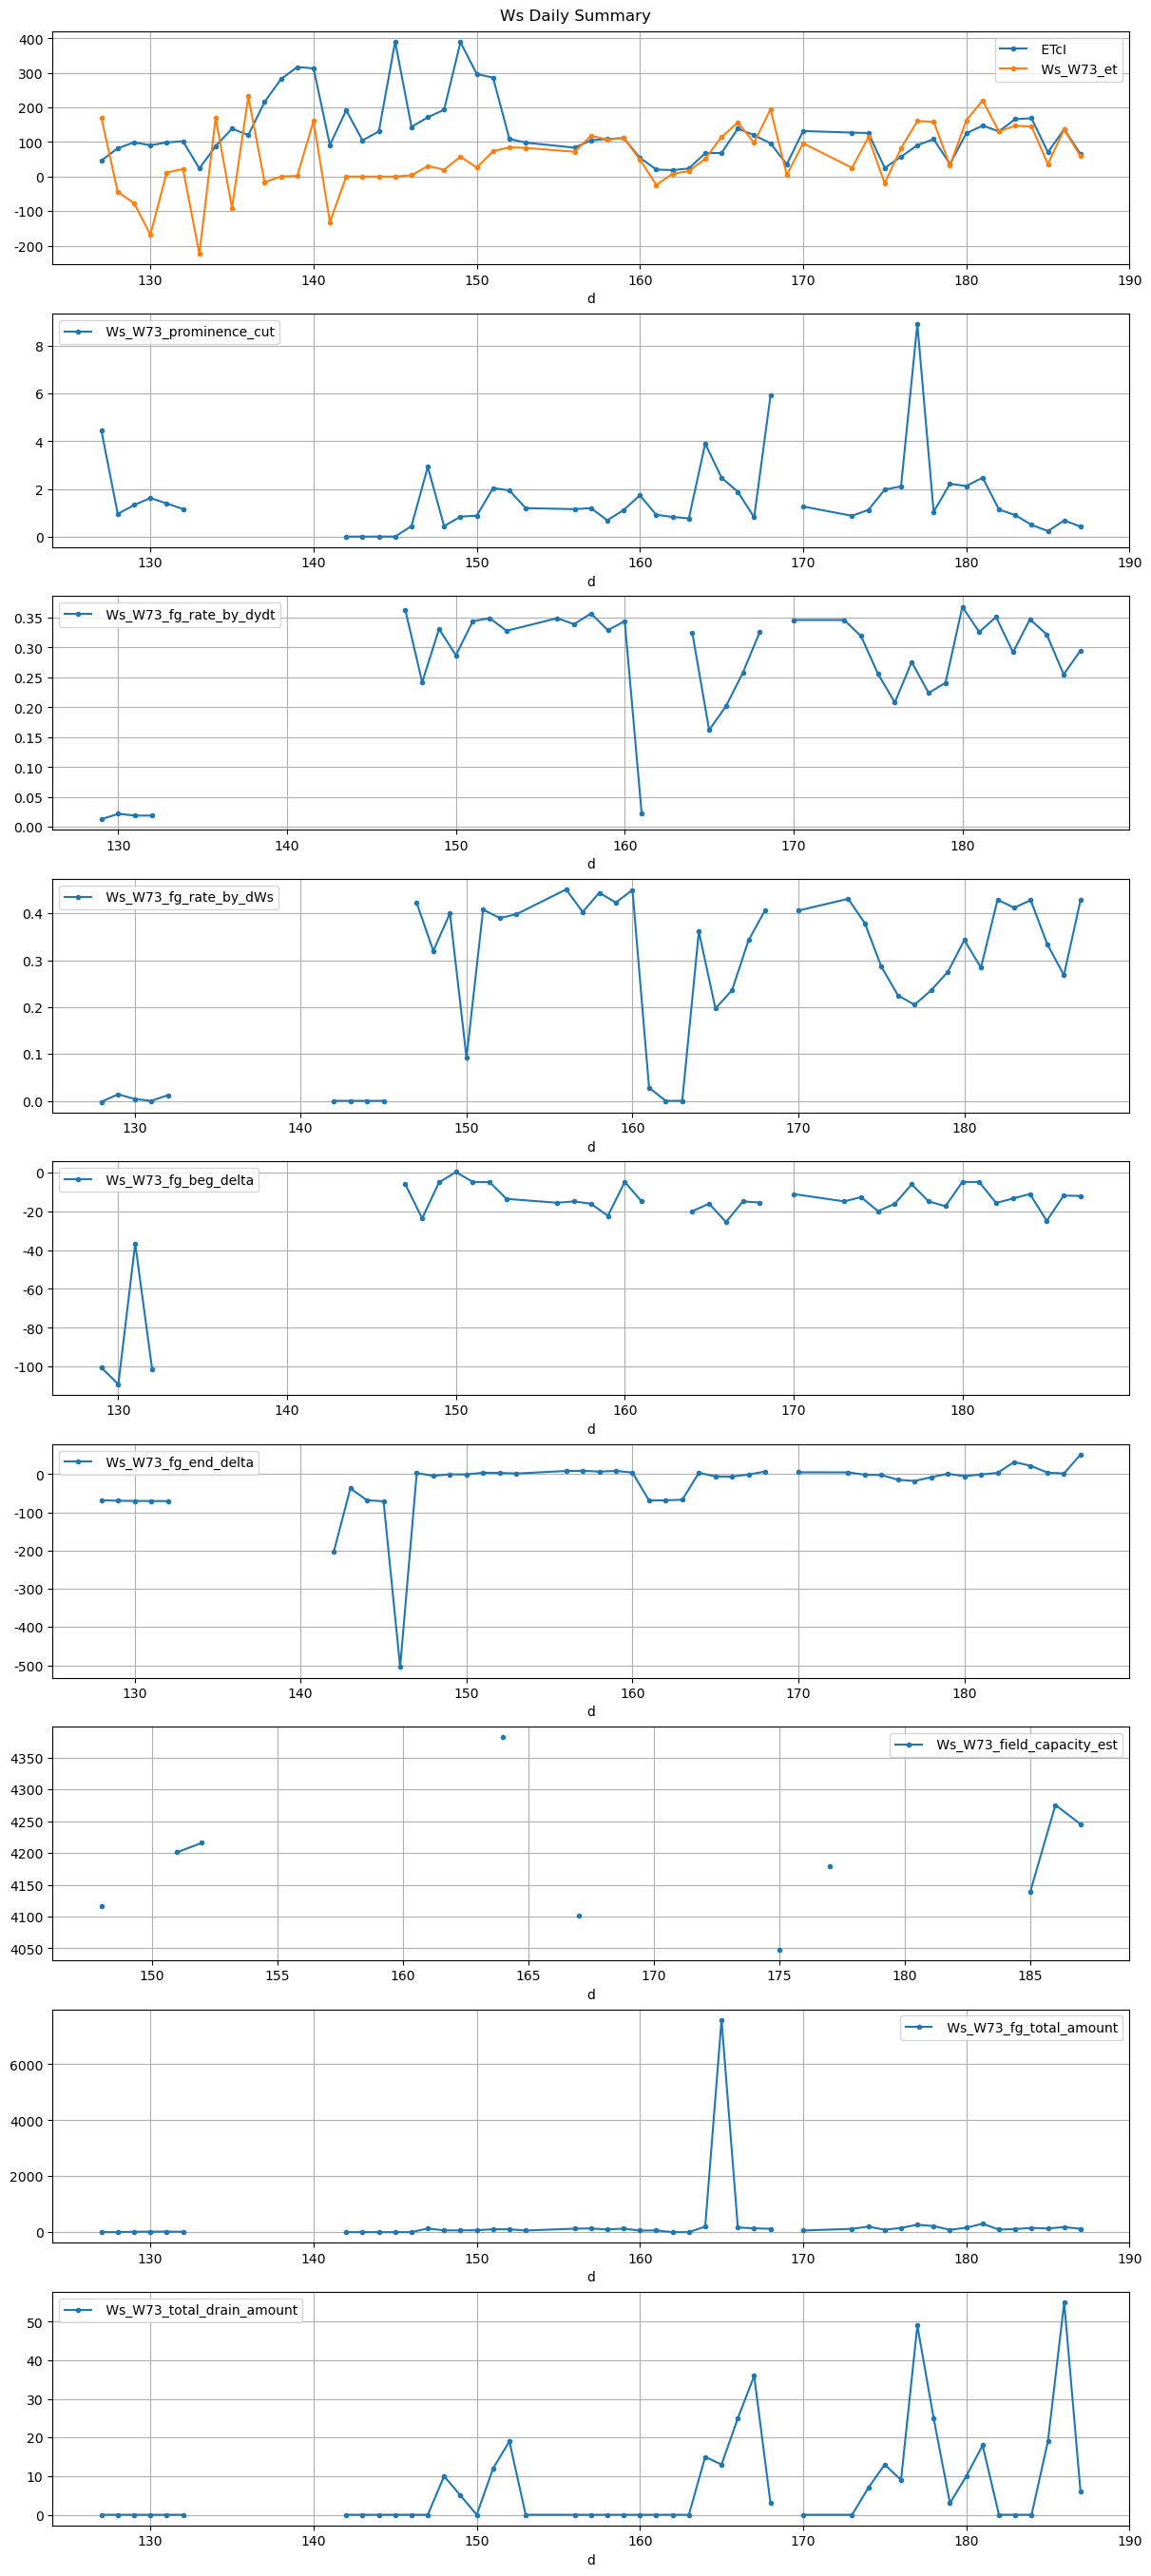
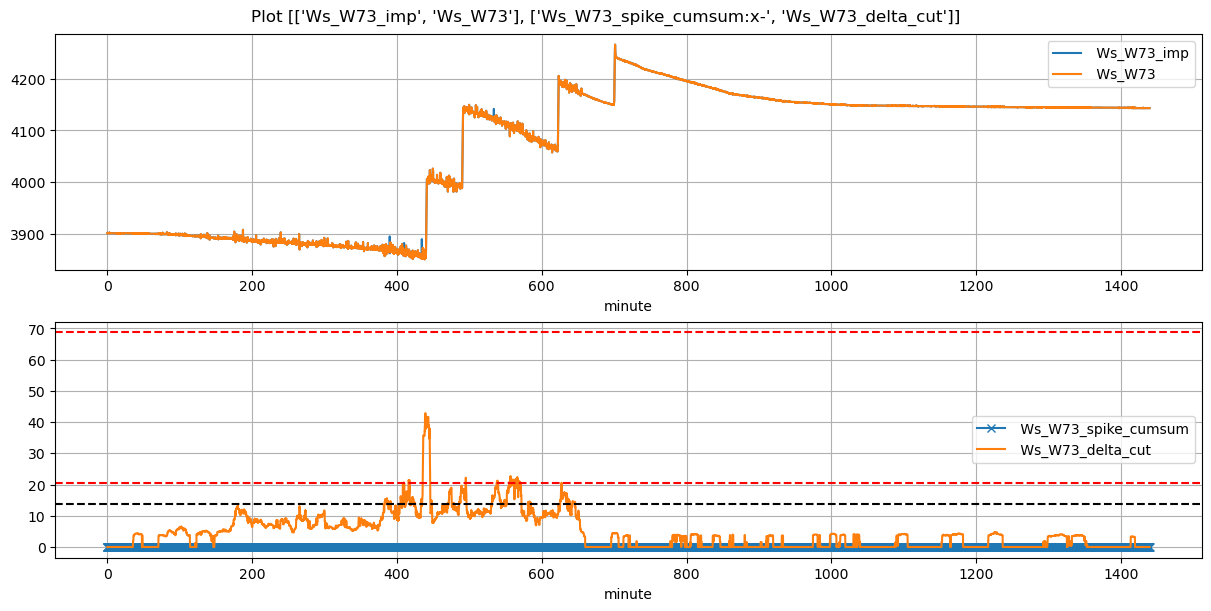
Ws_W73 |
0.421761 |
30 |
440.02 |
439.833333 |
441.20 |
445.500000 |
3854.000000 |
4023.333333 |
71 |
-0.000459 |
-0.067917 |
-0.037222 |
0.211500 |
0.476995 |
33.866667 |
True |
-11.2 |
258.0 |
33.866667 |
0.000000 |
0.000000 |
0.000000 |
25 |
517 |
-2.473845 |
NaN |
| 2026-04-11 08:10:01+08:00 |
187 |
490 |
Ws_W73 |
0.421761 |
30 |
490.02 |
489.833333 |
491.20 |
492.833333 |
3989.260000 |
4147.000000 |
71 |
-0.010122 |
-0.030625 |
-0.050556 |
0.308107 |
0.444338 |
31.548000 |
True |
-11.2 |
98.0 |
31.548000 |
0.000000 |
0.000000 |
0.000000 |
10 |
1083 |
-1.969649 |
NaN |
| 2026-04-11 10:22:13+08:00 |
187 |
622 |
Ws_W73 |
0.421761 |
30 |
622.22 |
622.000000 |
623.39 |
623.416667 |
4061.333333 |
4205.500000 |
70 |
-0.049882 |
-0.055822 |
-0.044630 |
0.344071 |
0.411905 |
28.833333 |
True |
-13.2 |
1.6 |
28.833333 |
0.000000 |
0.000000 |
0.000000 |
34 |
536 |
-1.842939 |
NaN |
| 2026-04-11 11:40:00+08:00 |
187 |
700 |
Ws_W73 |
0.421761 |
30 |
700.00 |
699.750000 |
701.18 |
701.250000 |
4149.644444 |
4266.000000 |
71 |
-0.031144 |
-0.090208 |
-0.050741 |
0.280905 |
0.327762 |
23.271111 |
True |
-15.0 |
4.2 |
26.980000 |
2.057521 |
4.115042 |
6.172564 |
140 |
14 |
-2.521655 |
4245.424788 |